
 +965 2292 4888


Economic Insight
22.10.2026
Government bond yields have been rising across most developed countries, including the US, hitting multi-year highs. The increase in US yields has been attributed to many reasons, including solid economic growth, higher oil prices/inflation, tighter monetary policy, poor fiscal metrics, and competition for capital from private-sector institutions. We think a key reason has been the strong economic growth, and this can be seen in the increase in real yields, which have moved hand-in-hand with nominal yields. The fact that this solid growth is being more driven by strong debt-funded investment spending linked to the AI-buildout underlines the justification for higher interest rates. Although there are skeptics, the unsustainable US fiscal trajectory is possibly another factor driving yields higher. For higher oil prices/inflation, we think the matter boils down to the sustainability of the current elevated oil prices; the longer oil prices remain elevated, the higher the probability that long-term inflation expectations will increase, pushing bond yields higher. A key question to answer is whether current levels of the 10-year yield can be described as overly elevated or not. While these levels are high versus recent years, compared with a longer history and taking into account economic growth and the fiscal situation, we believe current levels are not excessively elevated.
US bond yields rise on solid growth, higher oil prices, fiscal issues, and large private-sector bond issuances
Government bond yields have been rising across most developed countries, hitting multi-year highs, driven by many factors. In the US, the 10-year bond yield has recently hit the highest level in around 24 years, although it is off these highs currently. This increase in US yields has been attributed to many reasons, including higher oil prices/inflation, tighter monetary policy by the Fed, solid economic growth, poor fiscal metrics, competition for capital from private sector institutions especially AI hyperscalers, and an unwinding of the yen carry trade. A changing profile in terms of the type of holders of US Treasury bonds has also been quoted as a reason for higher US yields volatility.
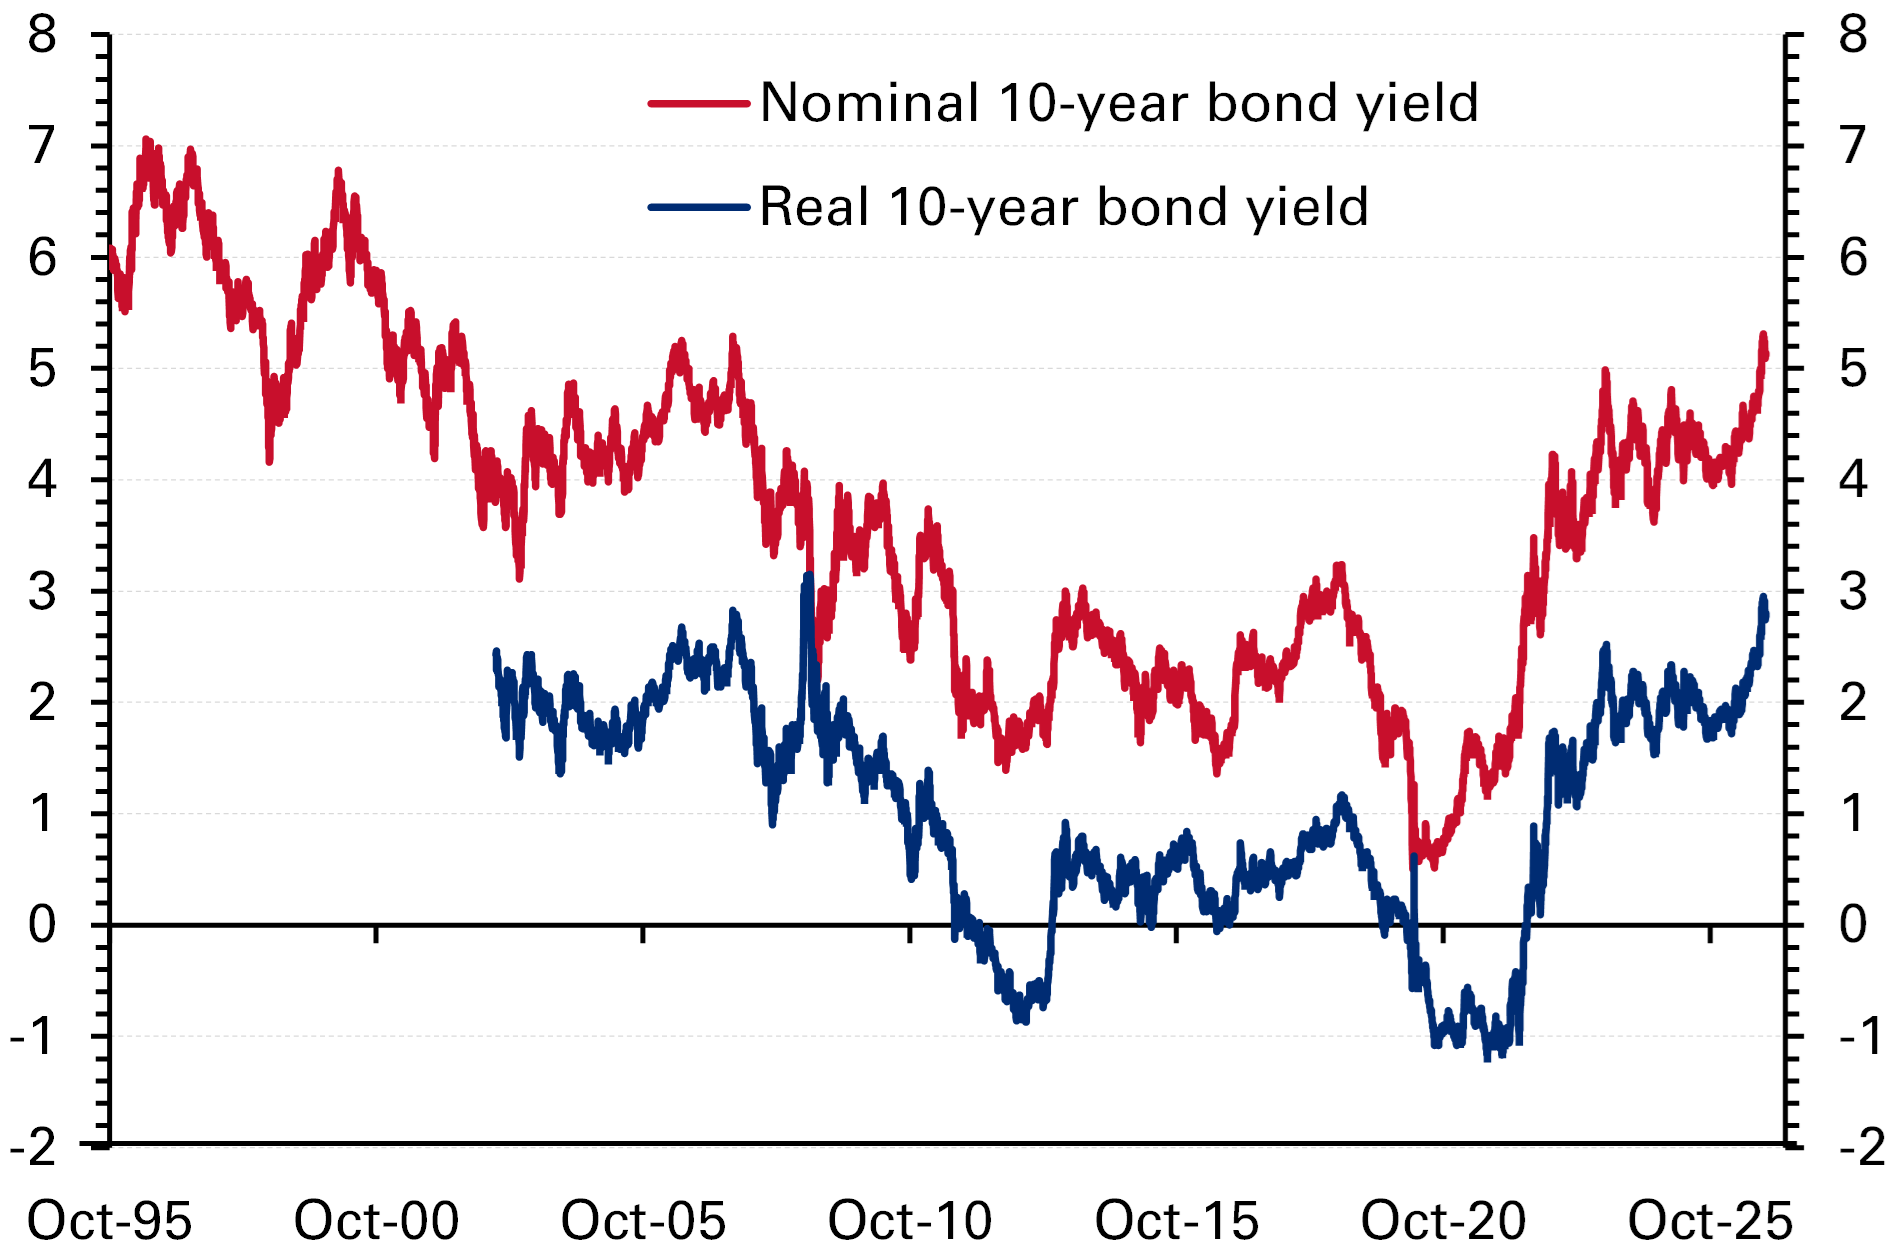
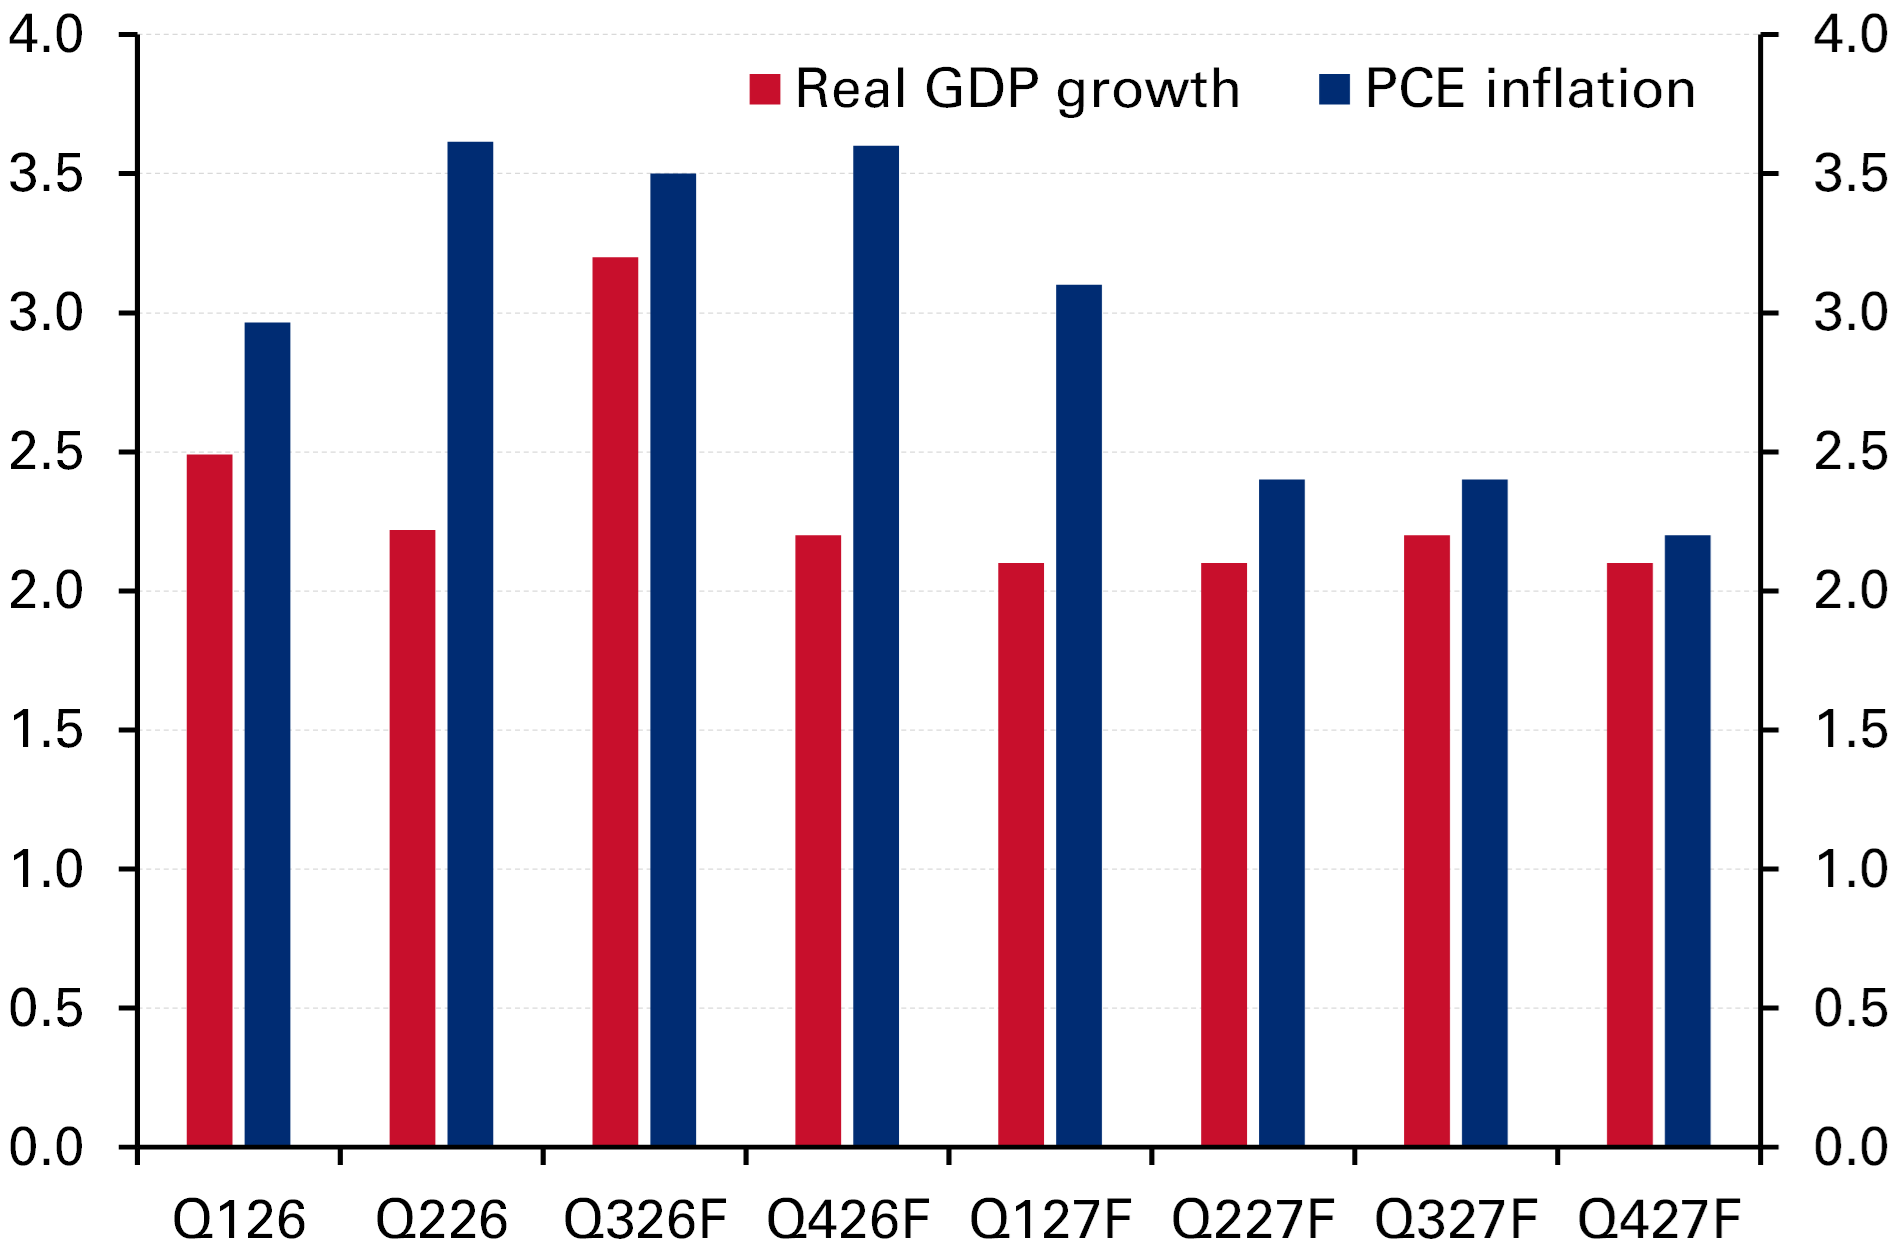
Among the various drivers pushing bond yields up, we think a key one has been the strong economic growth, both the recent actual and the outlook, despite the heightened geopolitical uncertainty and rising oil prices. This can be seen in the increase in real yields, which have moved hand-in-hand with nominal yields. The AI-linked investment boom and robust household consumption have more than offset the impact of the headwinds such as higher energy prices, increased tariffs, etc., with real GDP growth seen staying steady at an above-potential 2.3% in 2027 for the third consecutive year as per the IMF, chiming with solid growth consensus forecasts for that year. This strong growth outlook is also reflected in the “longer run” growth projection of the FOMC, which has been increased, back in March, to 2% from 1.8%, a rate that had prevailed for the past several years. Looking ahead, if economic growth decelerates, be it from a pull-back in AI-related demand or some other reason, that will put downward pressure on bond yields.
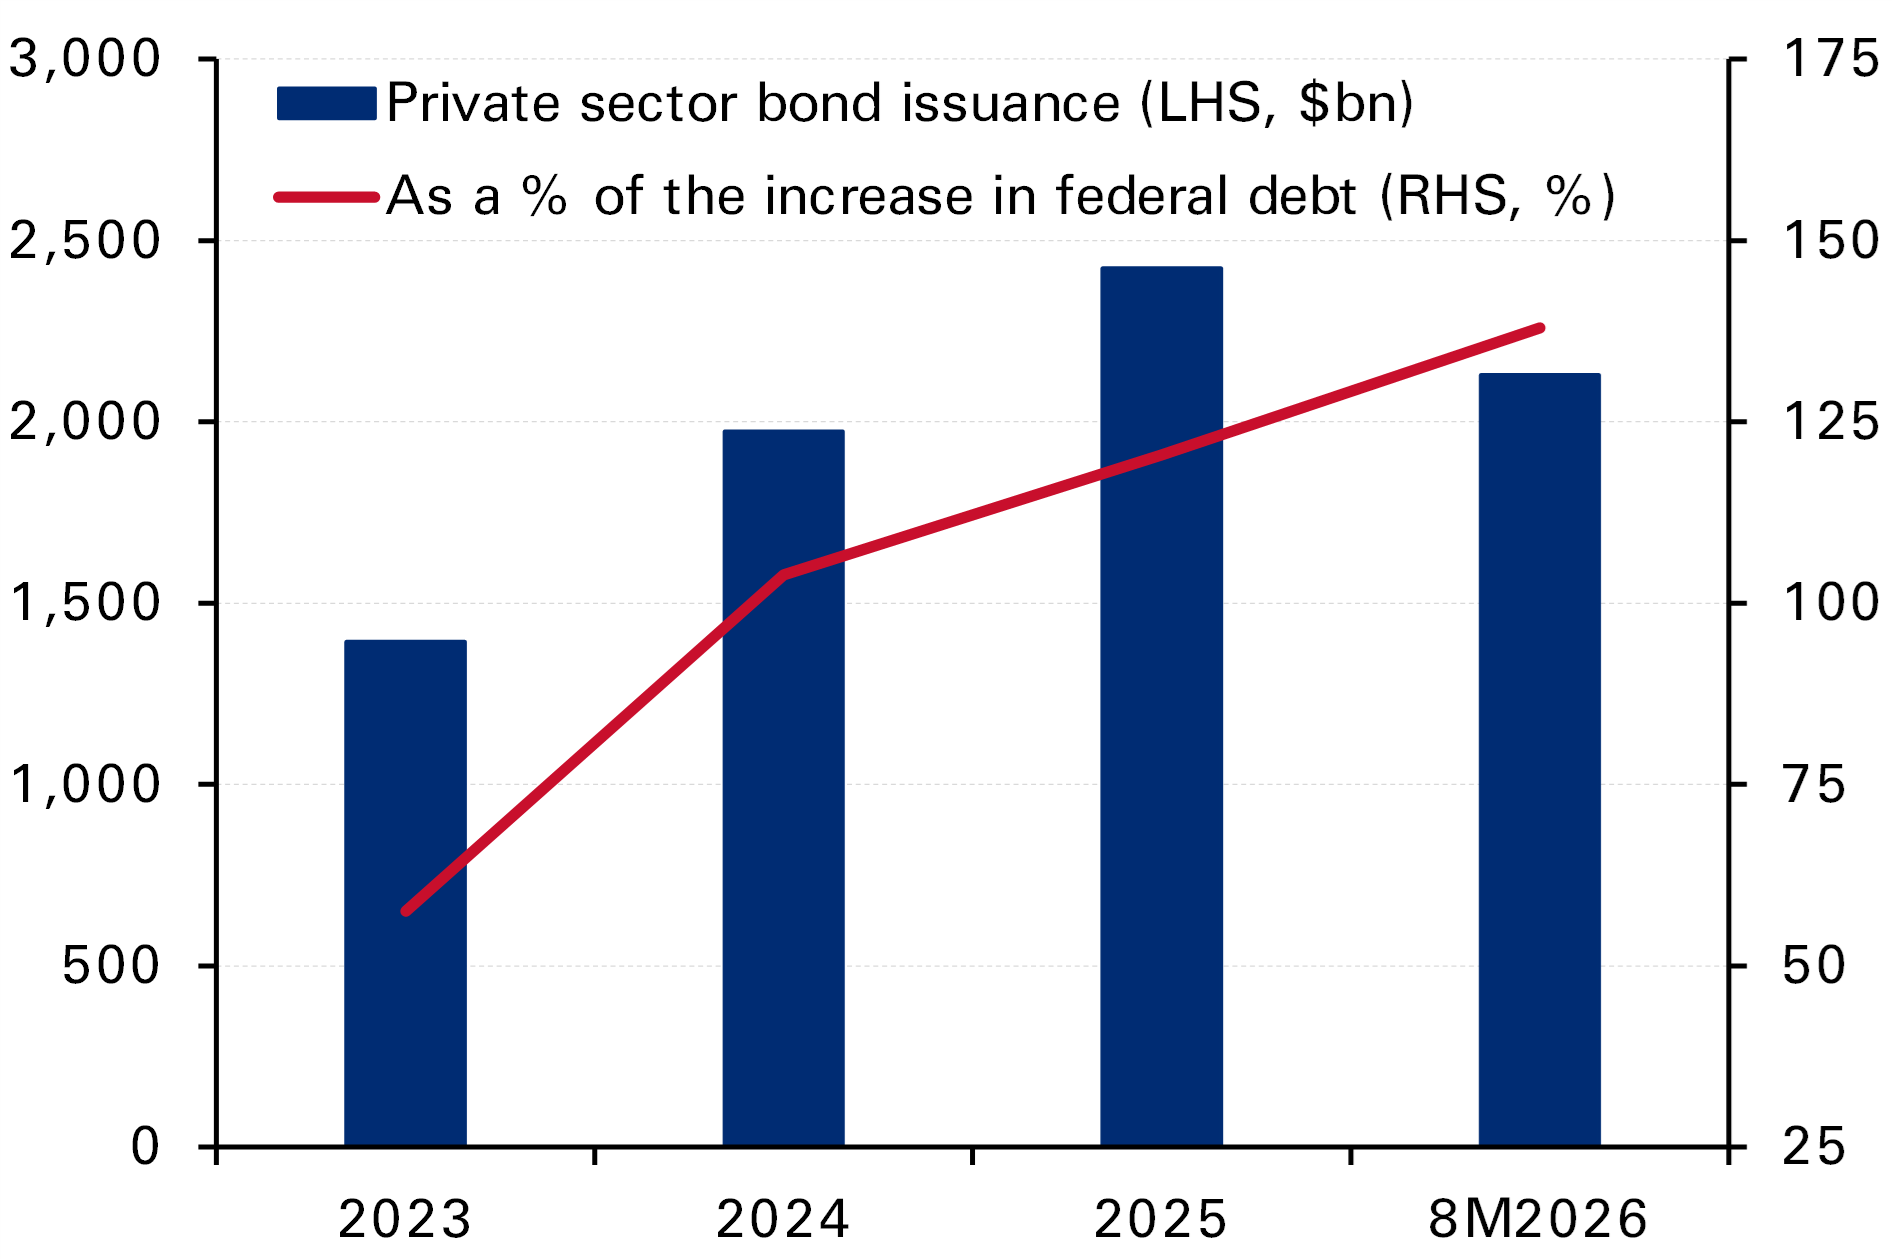
The fact that this solid growth is being more driven by strong investment spending linked to the AI-buildout further underlines the justification for higher interest rates. US private-sector institutions are raising massive amounts of debt, and this supply of bonds is competing with US Treasury issuances, leading to broader increases in borrowing costs. For example, total US private-sector bond issuance in 8M2026 reached $2.1 trillion, exceeding the net increase in US government debt held by the public (+$1.5 trillion) during the same period. So called “Hyperscalers” alone are expected to spend close to $1 trillion per year over the coming few years, mainly funded by additional debt, indicating that the competition for capital is expected to remain strong. However, if these spending/funding plans witness a pull-back, which is possible if meaningful cracks emerge in the AI story and the expected return on capital, government bond yields should drop.
It is only a matter of time until the worsening fiscal trajectory becomes a key driver of yields, if not already
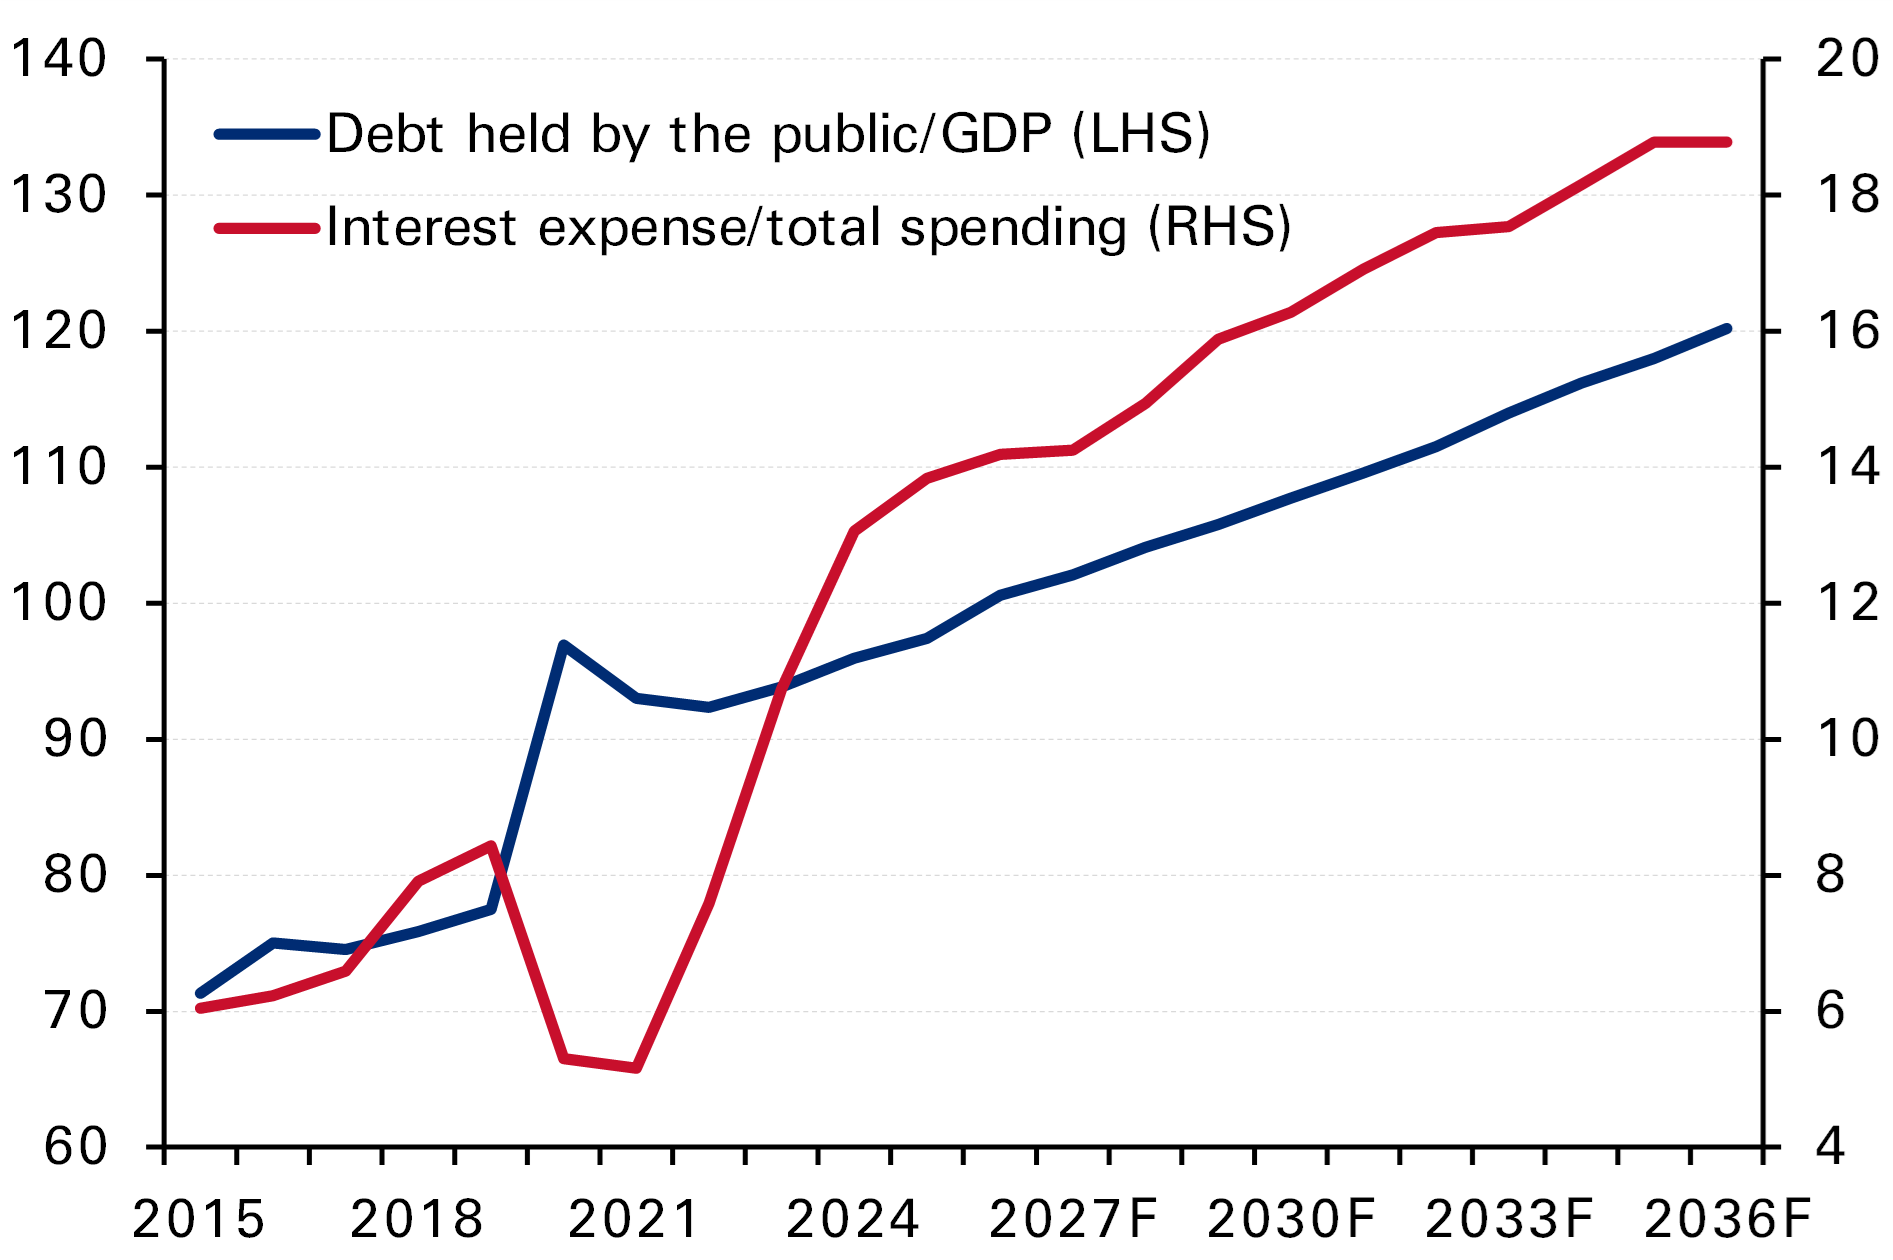
Another factor that is possibly driving yields higher is the ongoing worsening in the US fiscal position, which continues to be on an unsustainable trajectory. As per the non-partisan Congressional Budget Office (CBO), debt held by the public has now increased to around 100% of GDP (from 72% in 2015) and is expected to reach 120% by 2036. The budget deficit continues to be elevated, currently around 6% of GDP and forecast to remain in a 6% to 7% range through 2036. Not less importantly, interest expenses as a share of total spending have swelled to around 14% in 2025 (6% in 2015) and are projected to reach nearly 19% in 2036. Notably, current bond yields are already materially higher than the CBO’s model assumptions, indicating that the likely fiscal trajectory will be worse than what their latest model is showing. Still, there is no real political resolve in Washington to address the worsening US fiscal position, and things are not expected to change post the mid-term elections, irrespective of the winner. We note that some economists and observers, while acknowledging the poor state of the fiscal situation, think that it is not yet a driver of higher yields. While they may or may not be right currently, their argument will be harder to defend the worse the fiscal trajectory becomes. And given the wide consensus that the fiscal trajectory is on a deteriorating trend, it is only a matter of time until the fiscal situation becomes a key driver of yields, if not already.
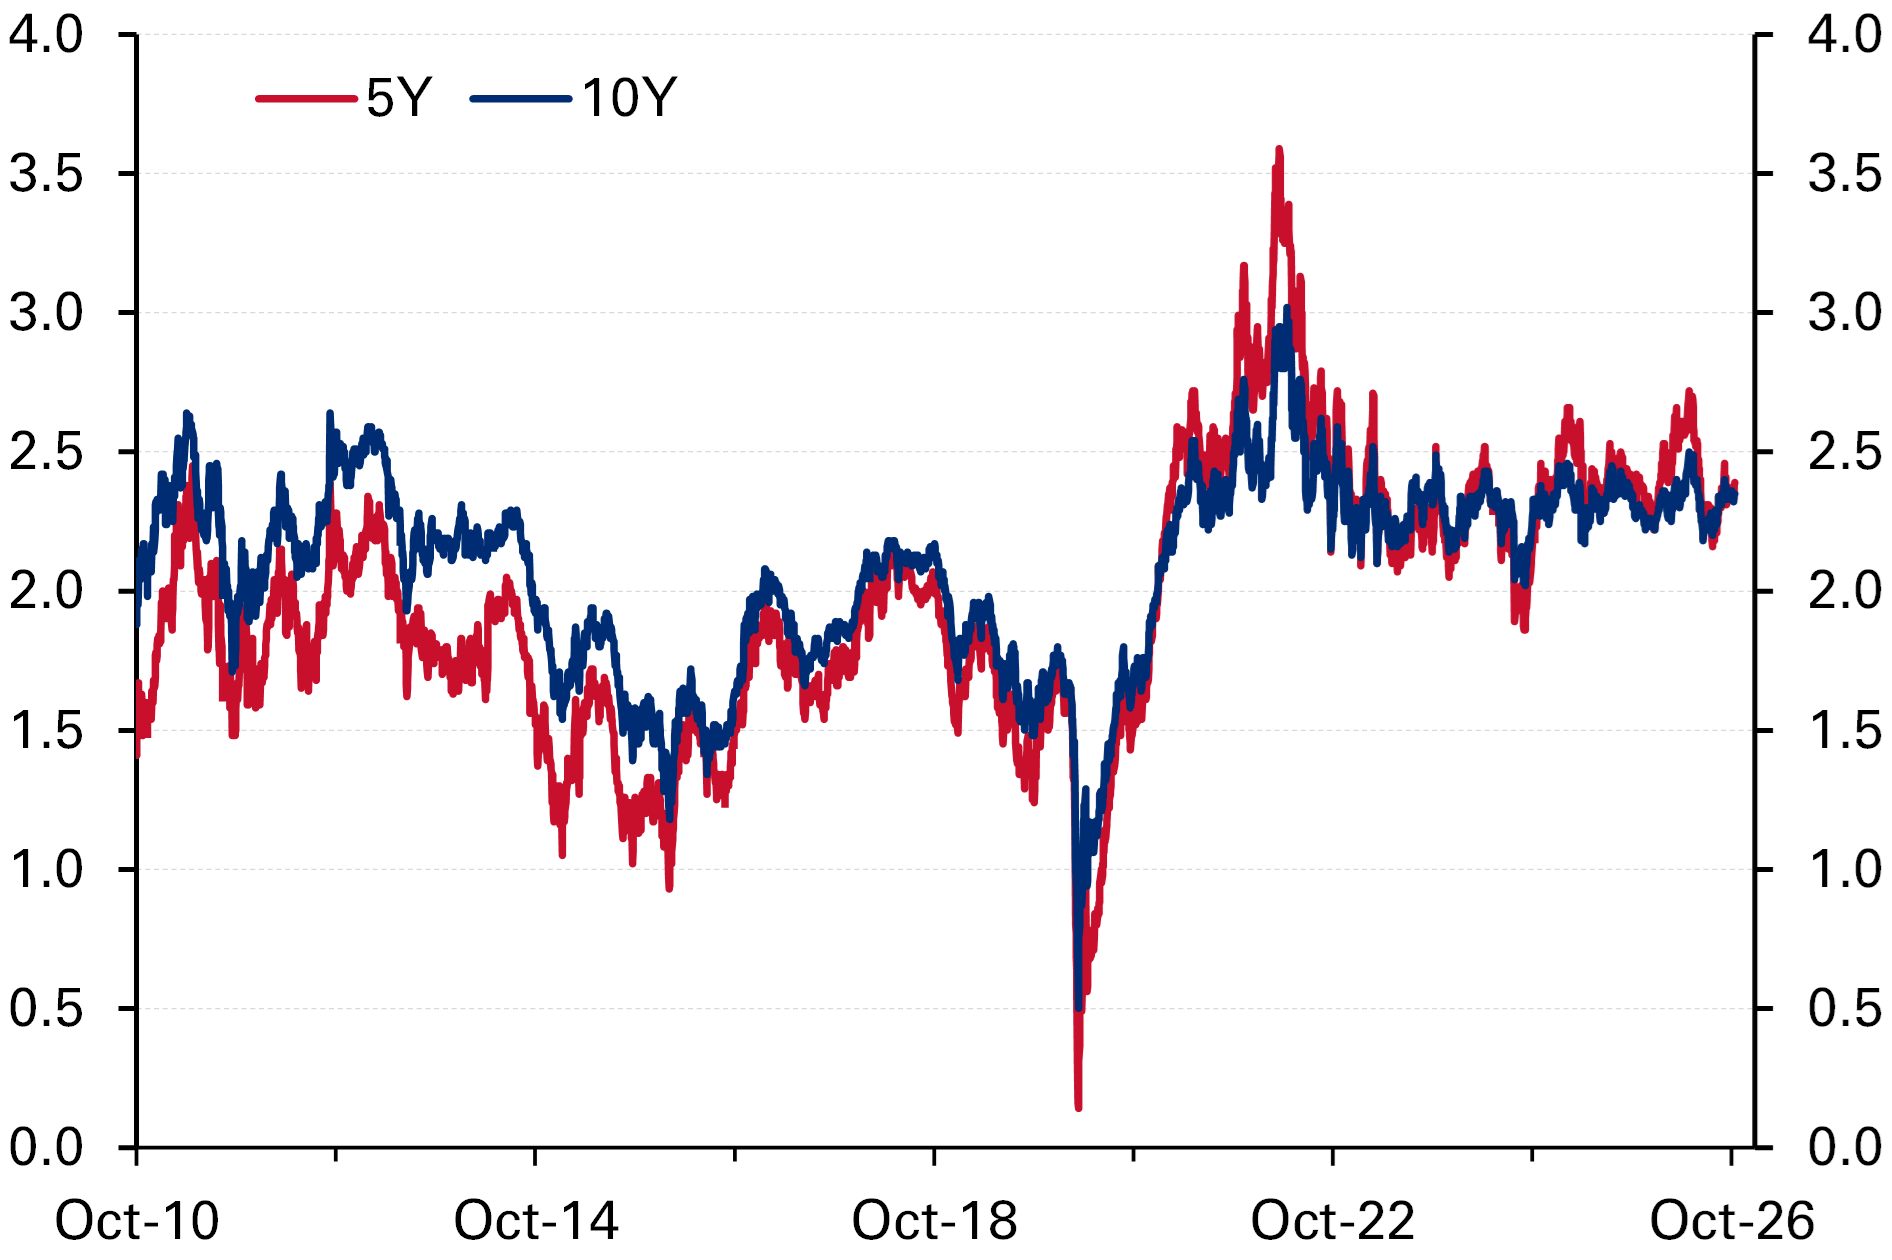
If oil prices remain elevated, the higher the likelihood inflation will become embedded, pushing yields higher
Higher oil prices, driving inflation higher and pushing the Fed to take a tighter monetary policy stance are additional reasons that have been mentioned as drivers of higher government bond yields. Here, first, how long-term bond yields will move in response to a tightening stance adopted by the Fed is uncertain. If term premia narrow, for example, due to expectations of lower inflation ahead, long-term bond yields may drop rather than increase. The often opposite movement in the 10-year yield, at least in the last couple of years, to both dovish and hawkish stances adopted by the Fed is testimony to that. On inflation specifically, it could be argued that the fact that it has been above the 2% target for more than five years and not expected to fall back to that target until late 2027 or sometime in 2028, that is a reason pushing long-term bond yields higher. However, at the same time, five-year and 10-year inflation breakeven rates have been broadly stable, indicating that inflation expectations over the long term have not moved up much, and hence, are not a key driver of higher bond yields. Putting other inflation drivers aside, we think the matter boils down to the sustainability of the current elevated oil prices. The longer oil prices remain elevated, the higher the probability that inflation will become embedded. If inflation becomes more embedded, long-term inflation expectations will increase, pushing bond yields higher. And here, it is geopolitics, the US/Iran as well as the Russia/Ukraine situations, and how much oil will be safely sourced from the Arabian Gulf region that will be the key determinants whether oil prices remain elevated or not.
Considering economic growth and the fiscal trajectory, the 10-year yield is not excessively high
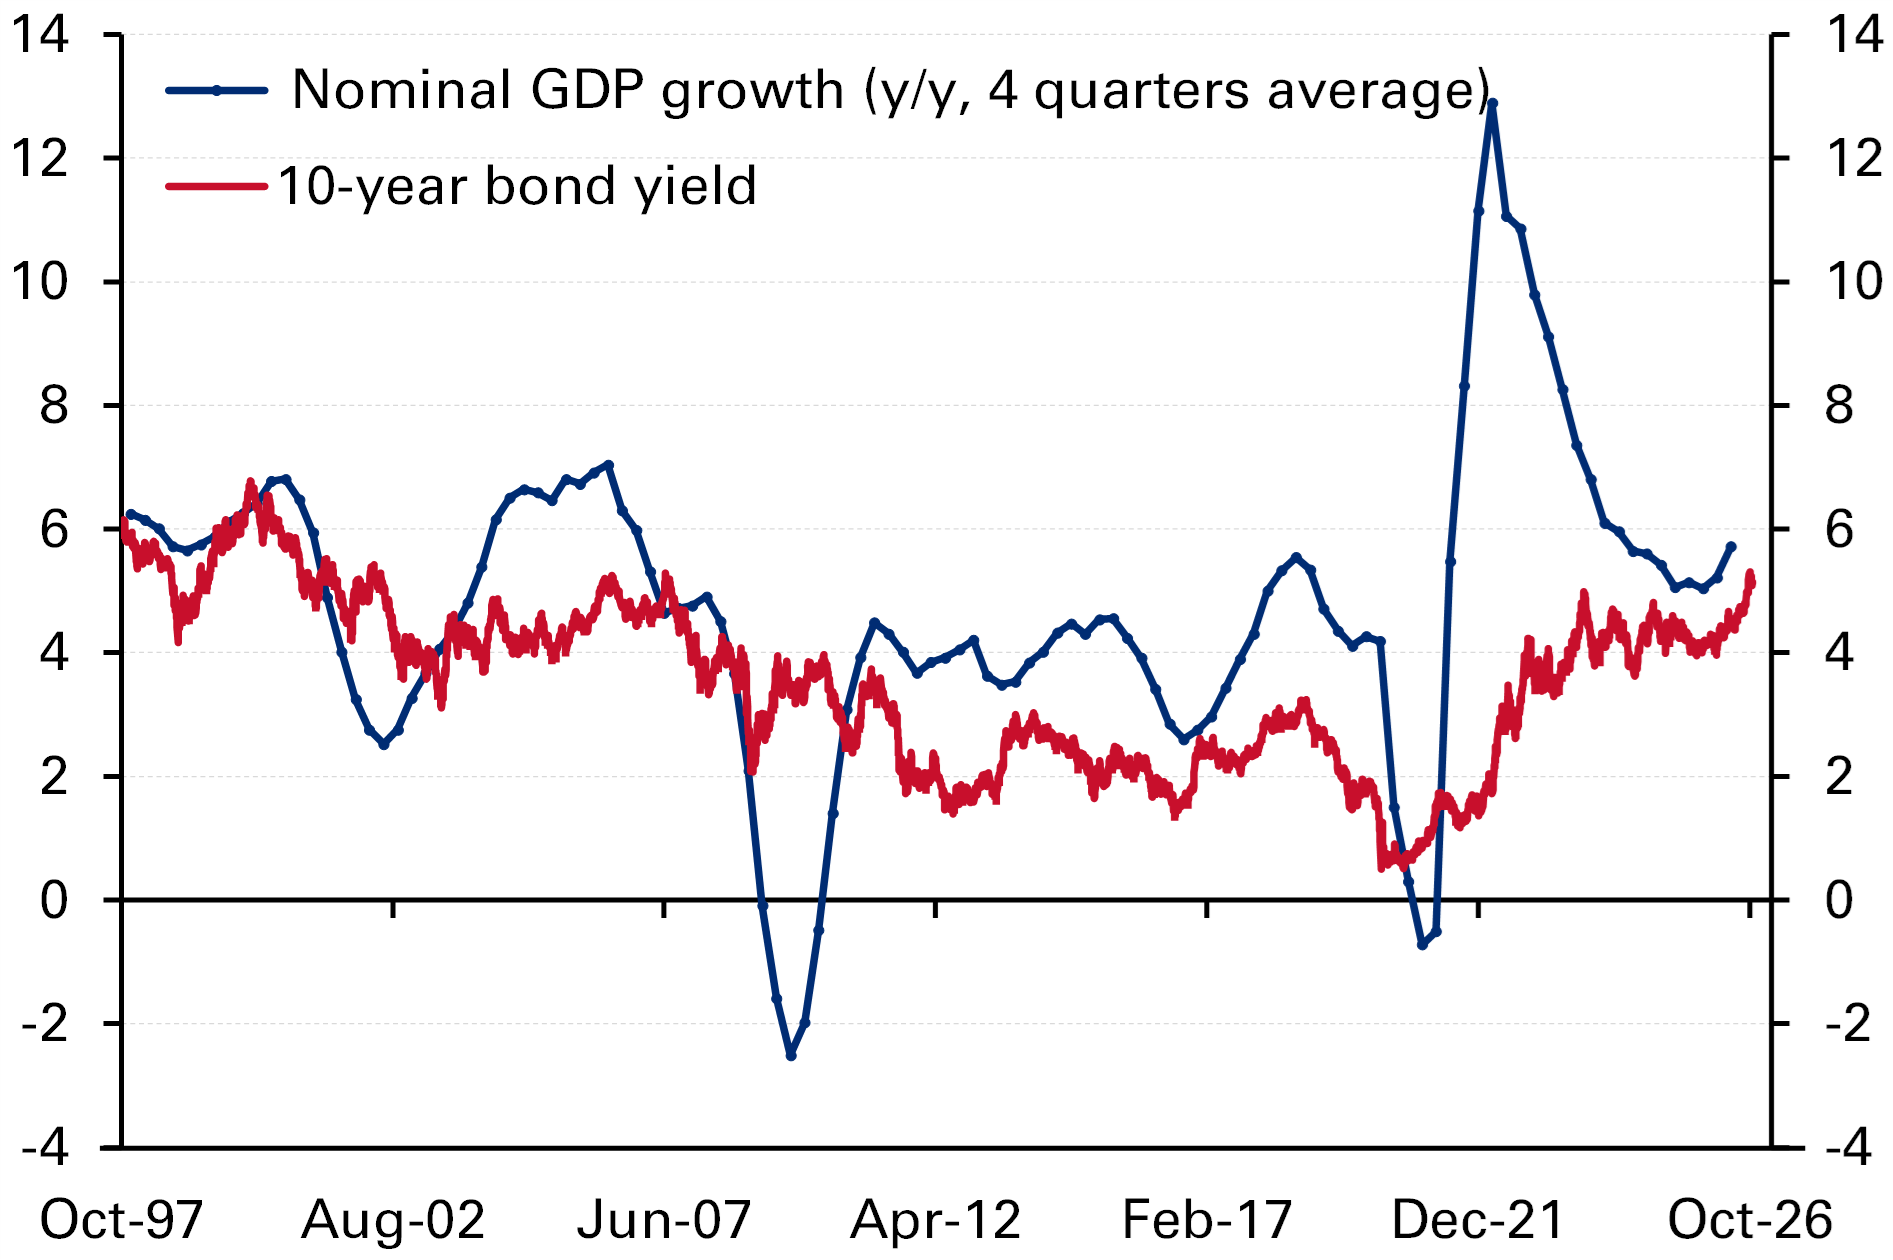
To conclude, a key question to answer is whether current levels of the 10-year yield can be described as overly elevated or not. While the current levels of around 5.1%-5.2% are high versus recent years, compared with a longer history and taking into account economic growth and the fiscal situation, we believe these current levels are not excessively high. These levels were common before the Great Financial Crisis of 2007-2009, after which the near-zero Fed policy rate that prevailed for many years, and the several rounds of Quantitative Easing had kept yields subdued. As seen in Chart 6, despite the volatility, there is a degree of correlation between the 10-year yield and nominal GDP growth over the long run. As seen, the latest numbers, GDP growth of 6.6% y/y in Q2 and a 10-year yield of 5.1%-5.2%, do not show any breakout of historical trends. If anything, that data along with the outlook for the fiscal trajectory, which is among the worst in US history, point to room for further increases in yields, assuming GDP growth remains solid.