 +965 2292 4888


Oil Brief
24.09.2026
Oil prices were back above $100 in September amid a spike in geopolitical risk linked to militant attacks on Saudi oil infrastructure and ongoing irresolution to the US-Iran conflict. The entry of the Houthis has opened a second front, limiting export flows through the Red Sea and threatening to tip the global oil market into a deeper deficit while global oil inventories deplete at a record pace and despite regional producer workarounds and higher exports from outside the region. In the absence of a deal to fully open the Strait of Hormuz in the near term, market fundamentals will remain tight and crude oil prices high.
Oil price movements: prices top $100/bbl on Houthi-linked geopolitical risk, product markets in distress
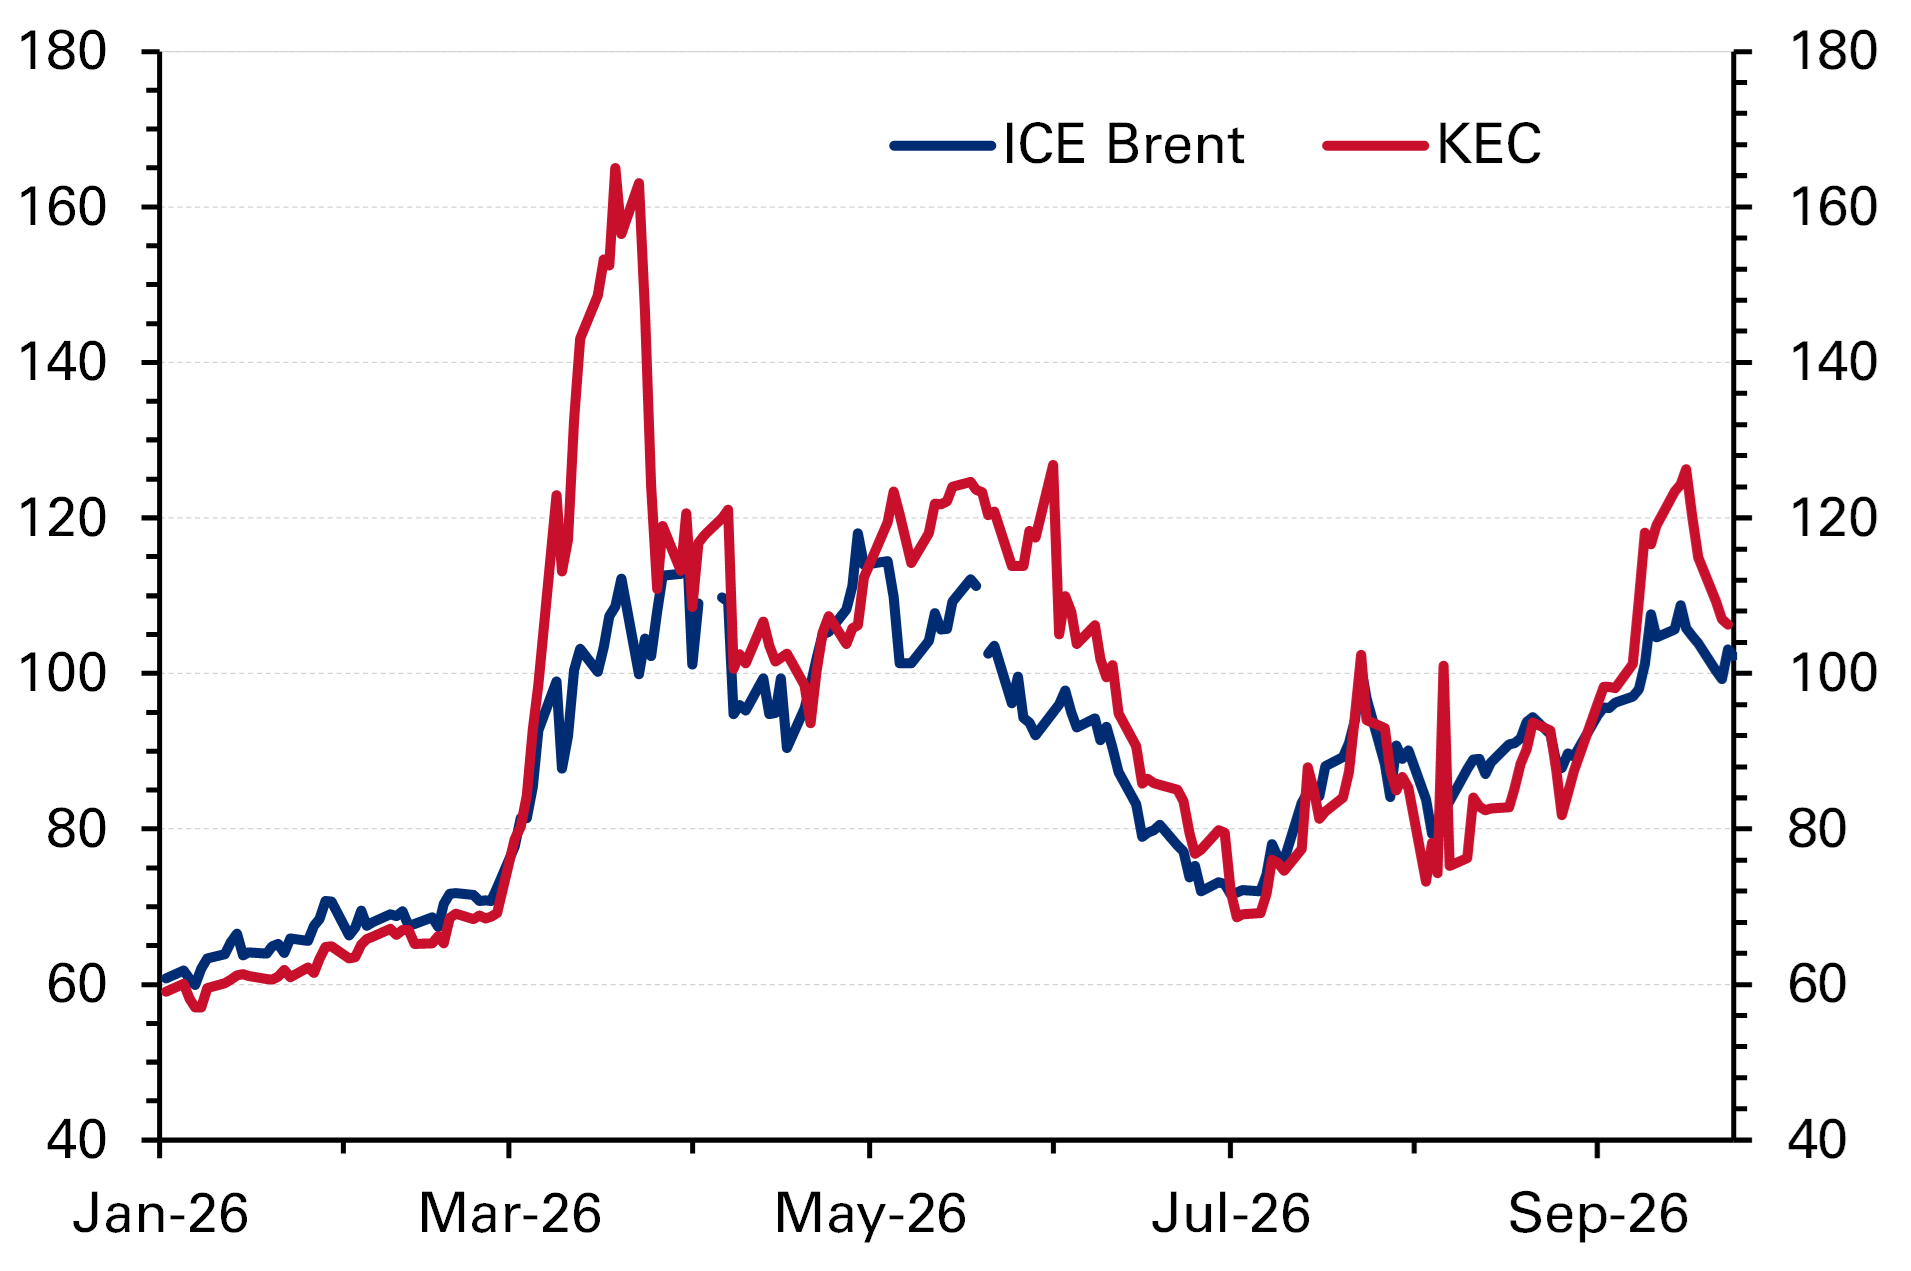
The global oil market has remained subject to immense pressure in recent weeks, amid continued fallout from the US-Iran conflict and severe disruption to shipping in the Strait of Hormuz (SoH). Oil prices began to rise again after the MOU between the two sides collapsed in July and surged back above the symbolic $100/bbl level in early September as the Houthis and Iran-aligned militias entered the fray, effectively closing off the Bab el-Mandeb to Saudi oil exports and significantly raising the threat level to the kingdom’s energy infrastructure. The key 7 mb/d East-West pipeline had to be taken offline for several days after a pumping station was struck but has since been partially reopened as the kingdom doubled down on repair and workarounds. Saudi efforts to reassure the market and talk of a restart in US-Iran diplomatic negotiations did pull Brent below $100/bbl briefly. Meanwhile, tanker flows through the Strait under heavy US navy escort continue in defiance of the Islamic Republic (see below).
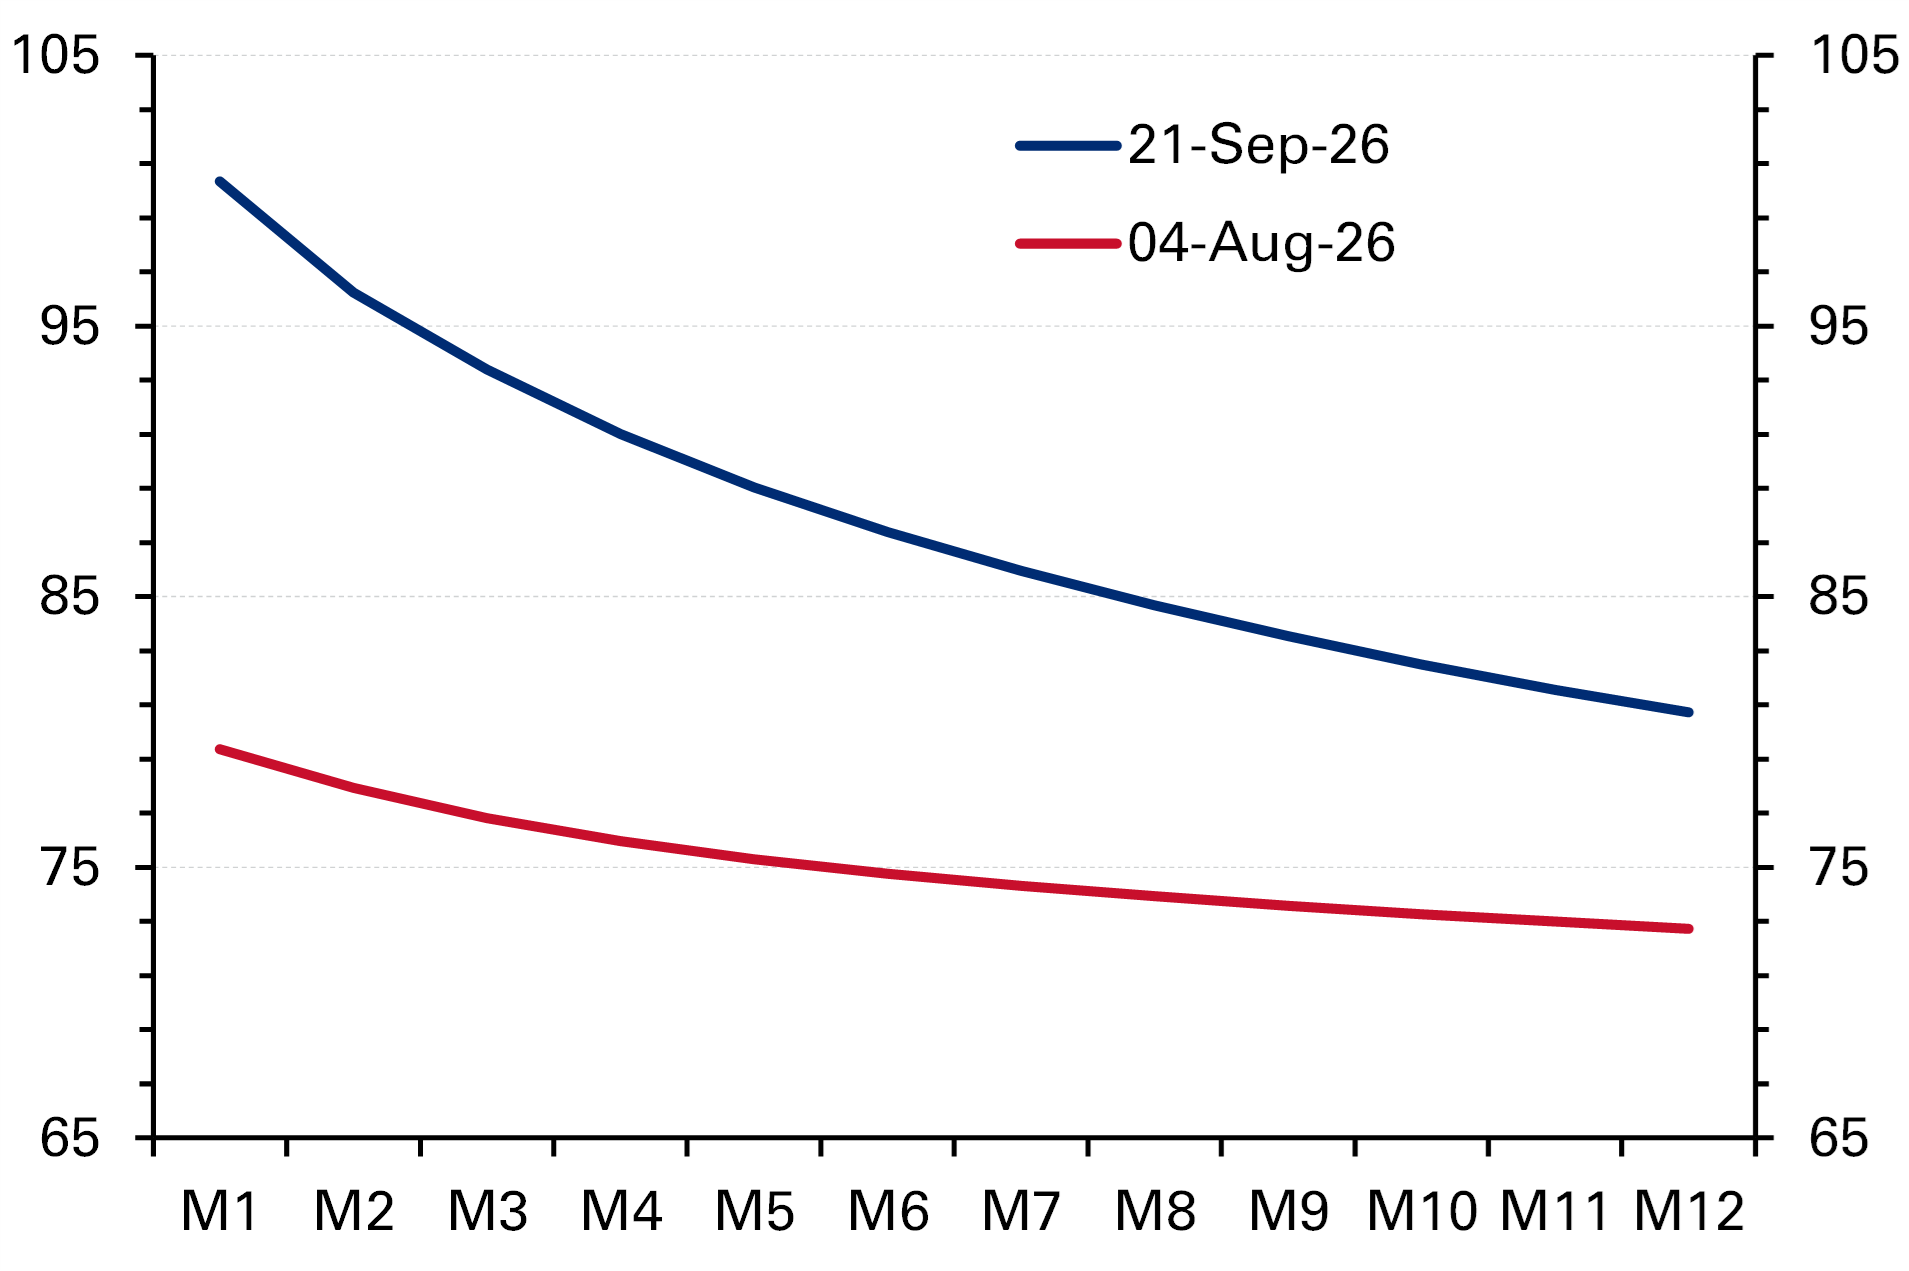
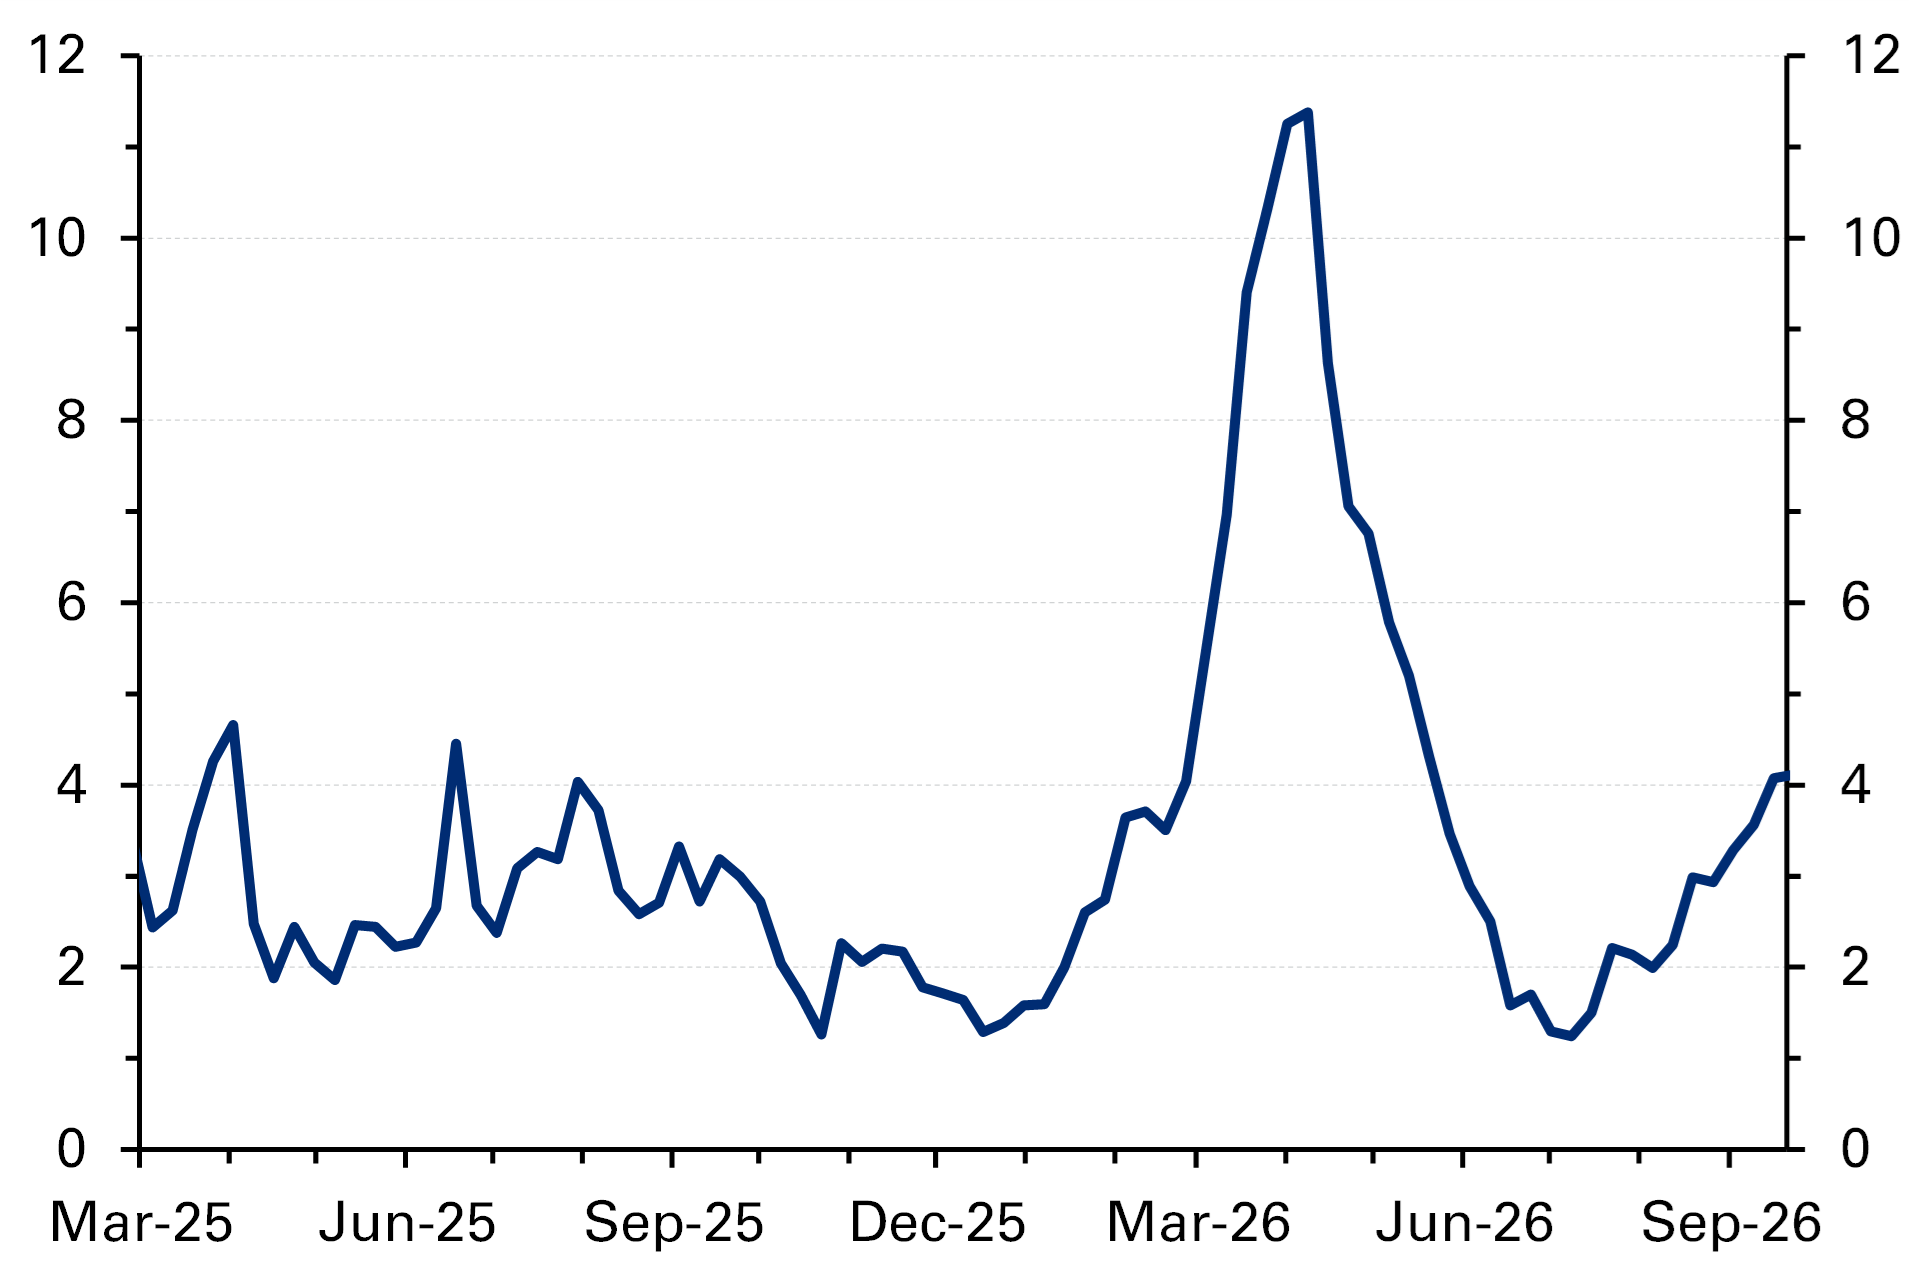
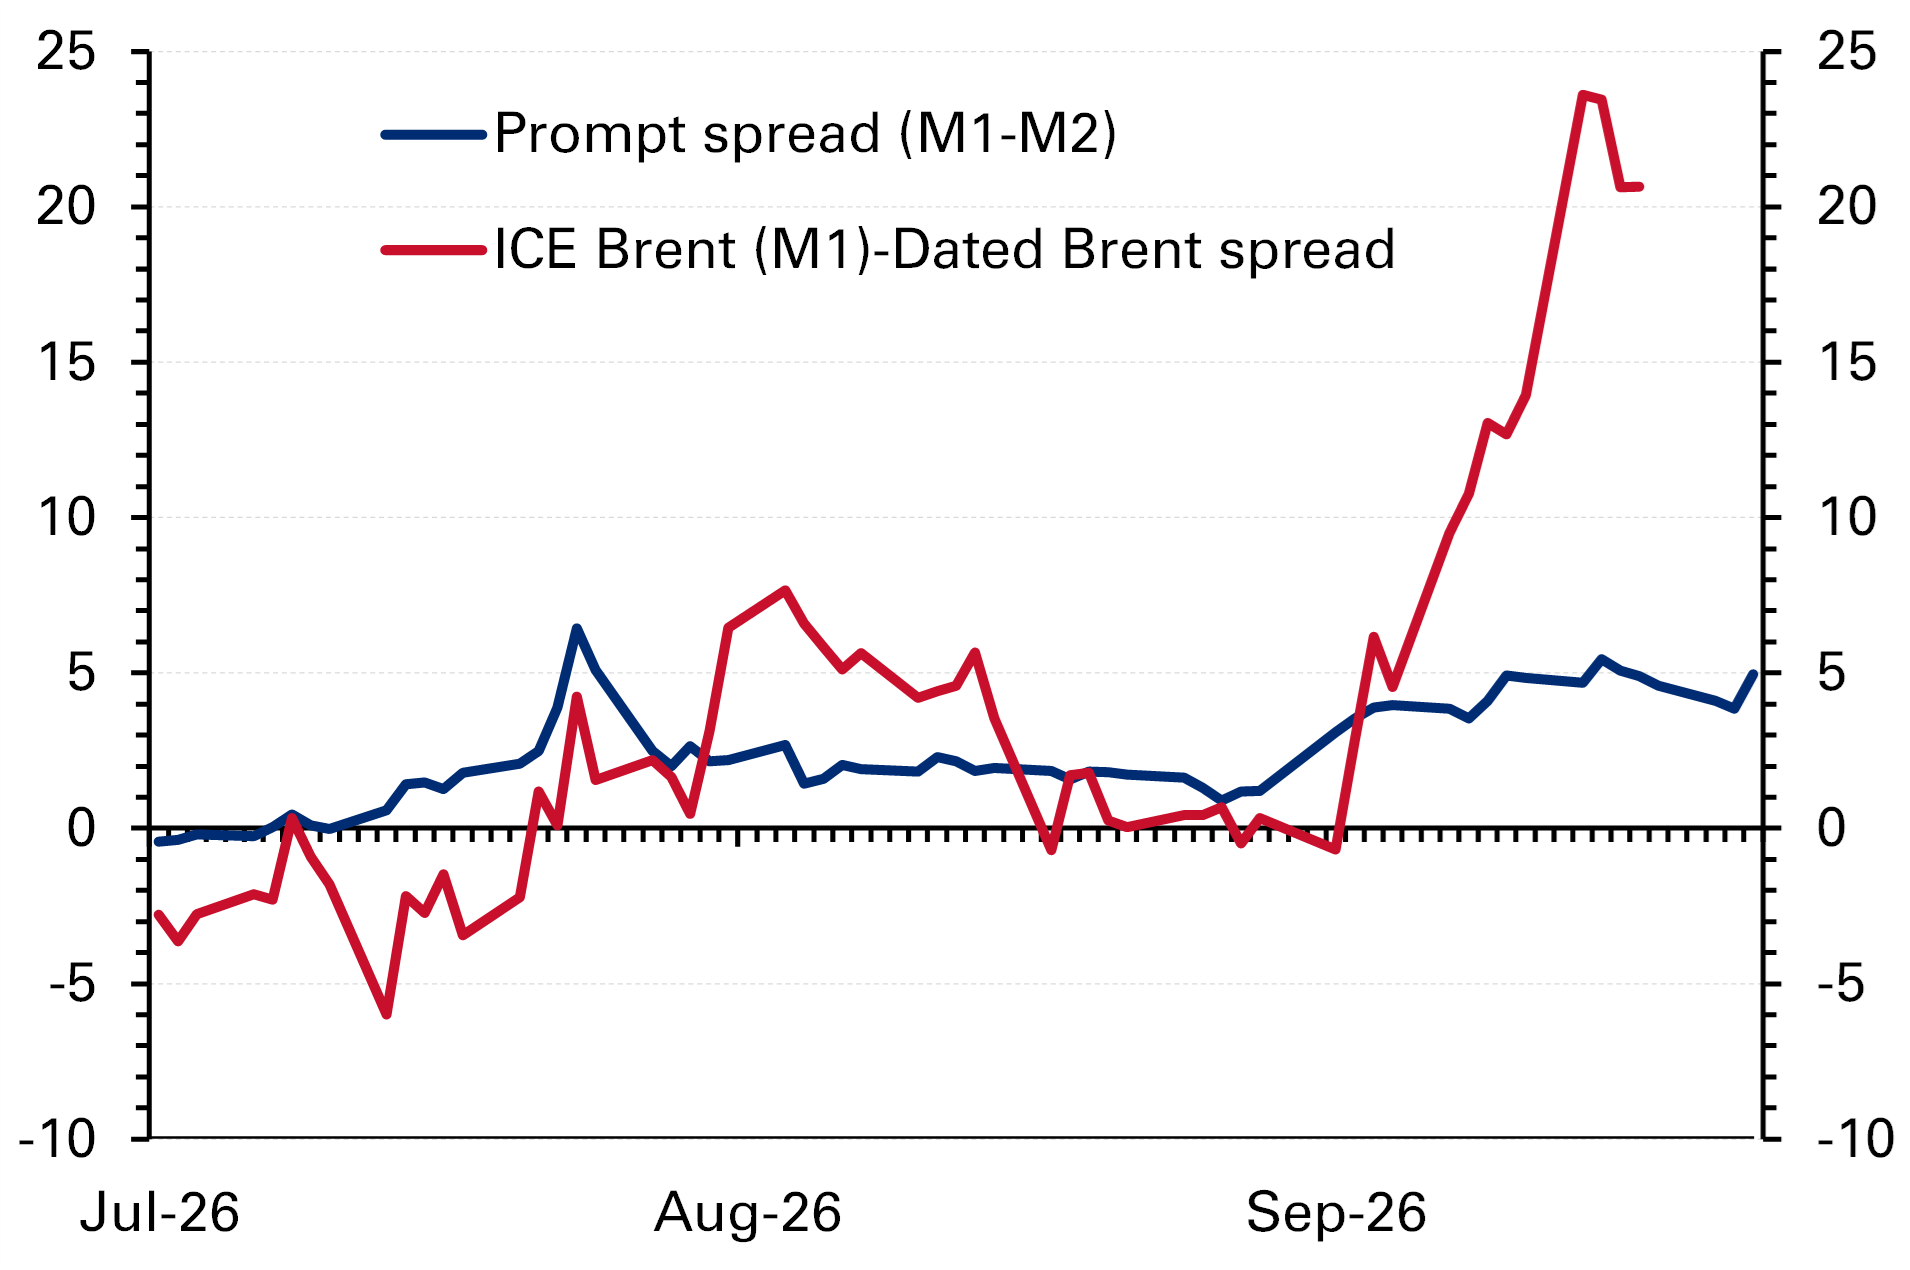
Nevertheless, the oil futures and physical markets especially continue to signal extreme supply tightness. Brent time spreads (M1-M2) remain in the $4-5/bbl range—much higher than the <$1/bbl average in February—and firmly backwardated, while the Brent physical marker, Dated Brent (Platts), fetched $132/bbl on 15 September, a $23/bbl premium over ‘paper’ Brent. (Chart 2.) It is a similar story with local crude grades, where Kuwait Export Crude’s increase to a four-month high mid-month reflects a deep structural deficit in the market for medium-sour barrels, the grades most disrupted by the closure of the SoH and the variety most in demand by Asian refiners.
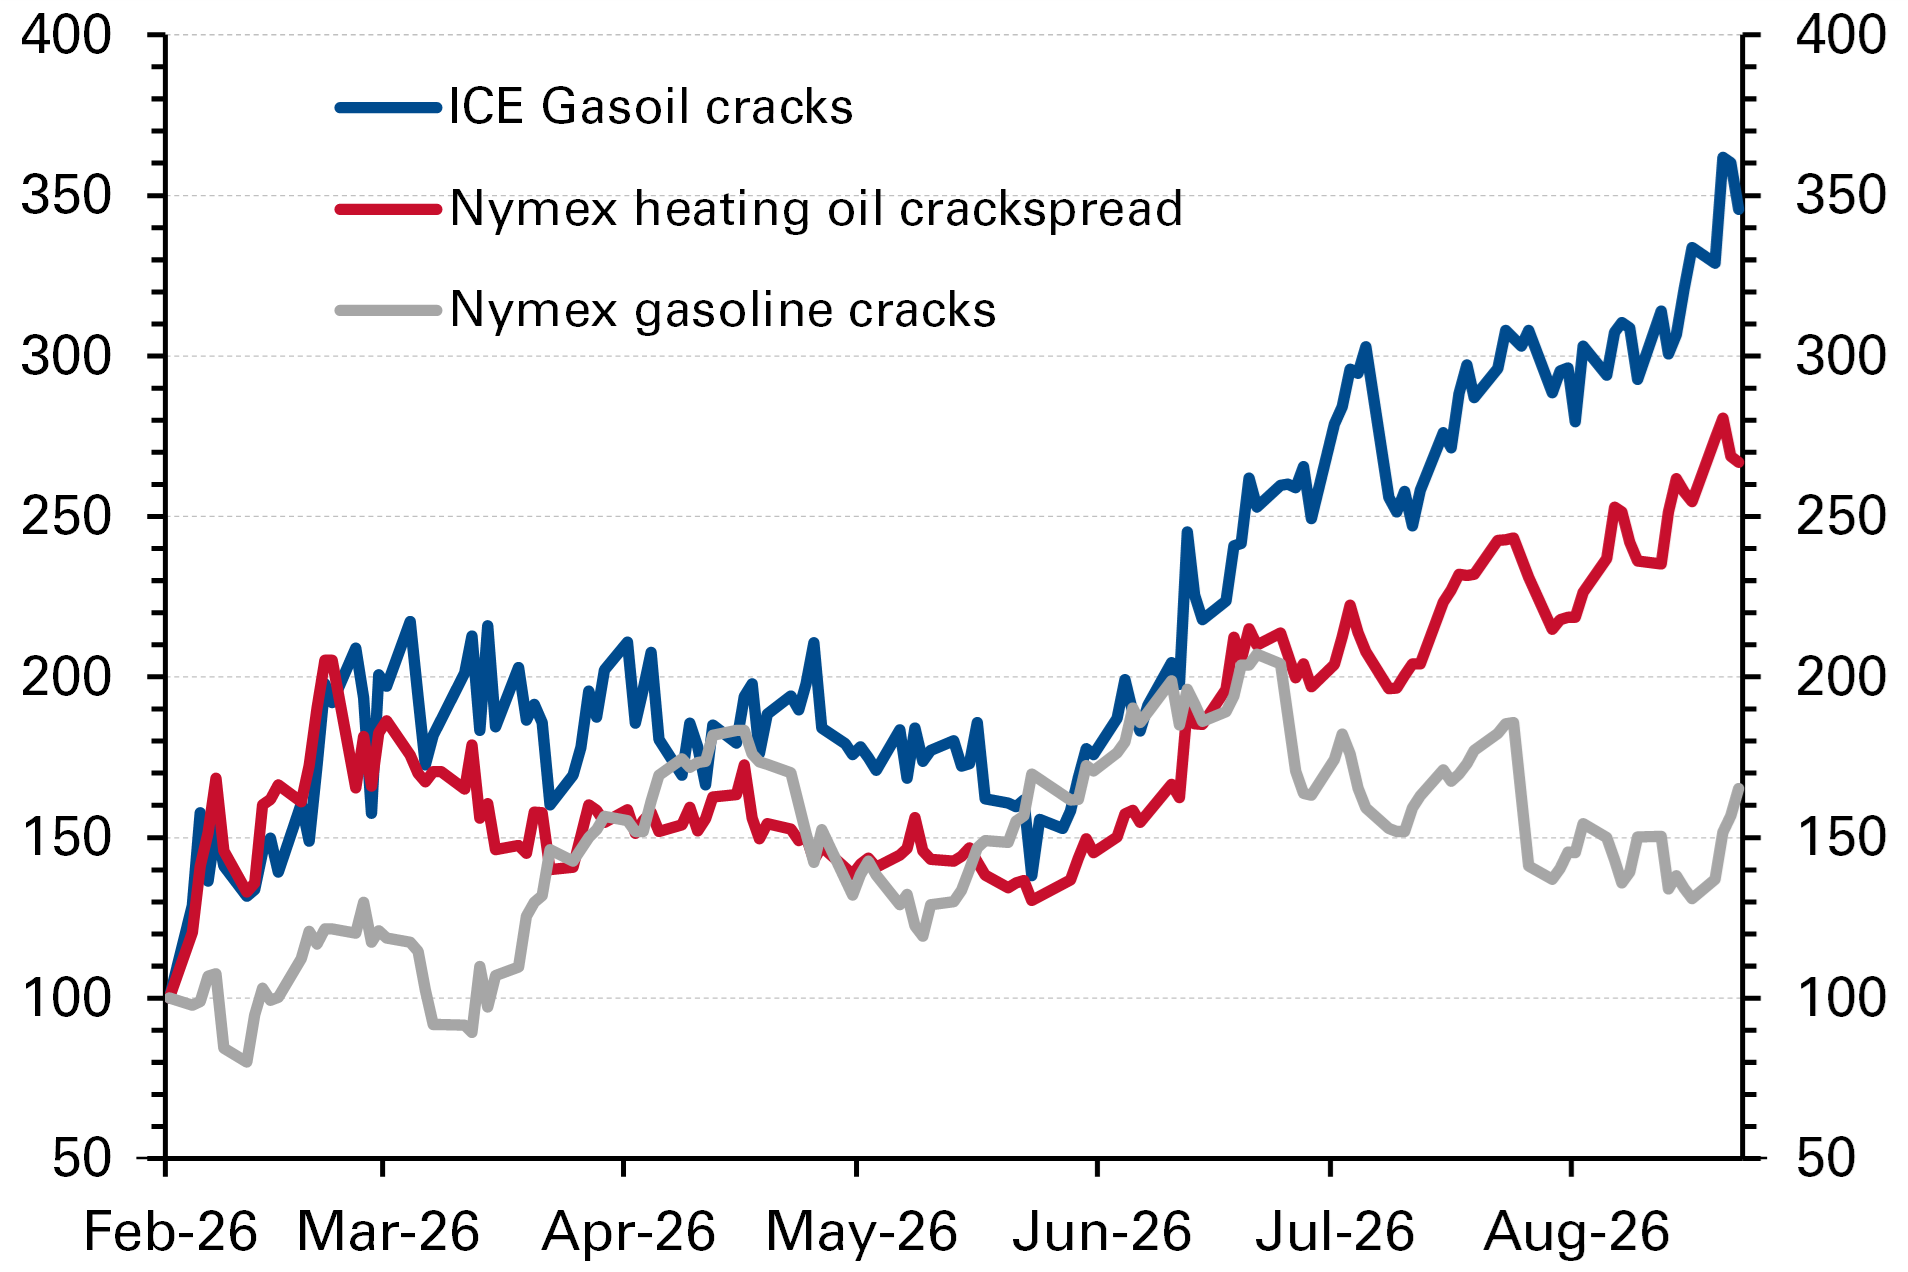
Nowhere is the distress more acute than in the refined products market, which has seen blowouts in the prices of diesel/gasoil (the world’s industrial fuel), gasoline and jet fuel. US diesel prices just topped $6.5 a gallon, a record, and average gasoline prices headed north of $4.4 a gallon, while over in Europe, diesel futures closed at all-time highs recently, double their levels at the start of the year, due to a ‘perfect storm’ of product shortages caused by the Ukraine-Russia and US-Iran conflicts as well as by Chinese export rationing. Refining margins and crack spreads have surged, with diesel exceeding $100/bbl.
Oil demand: Gulf conflict a “lost period” for global oil consumption
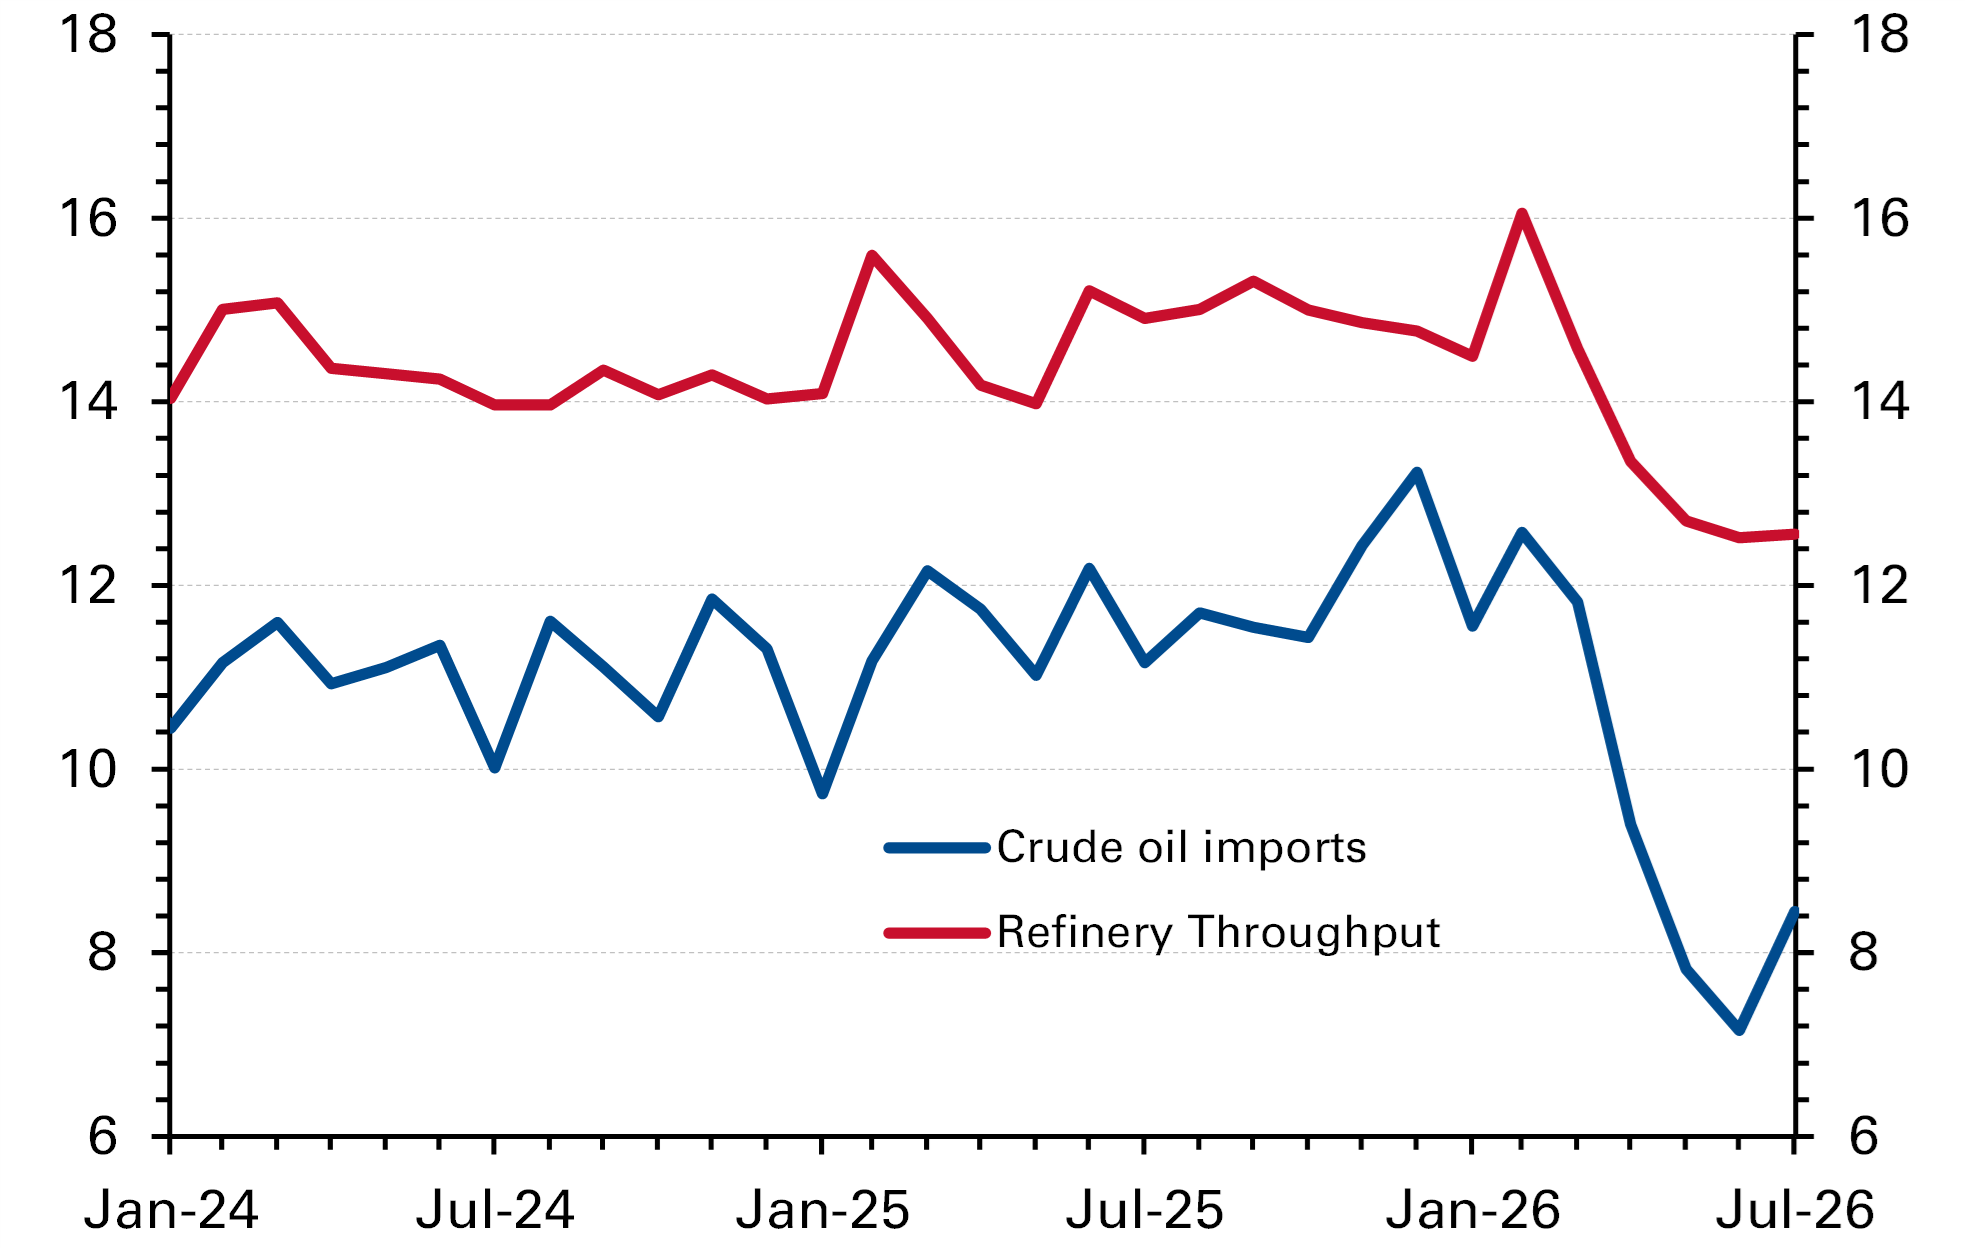
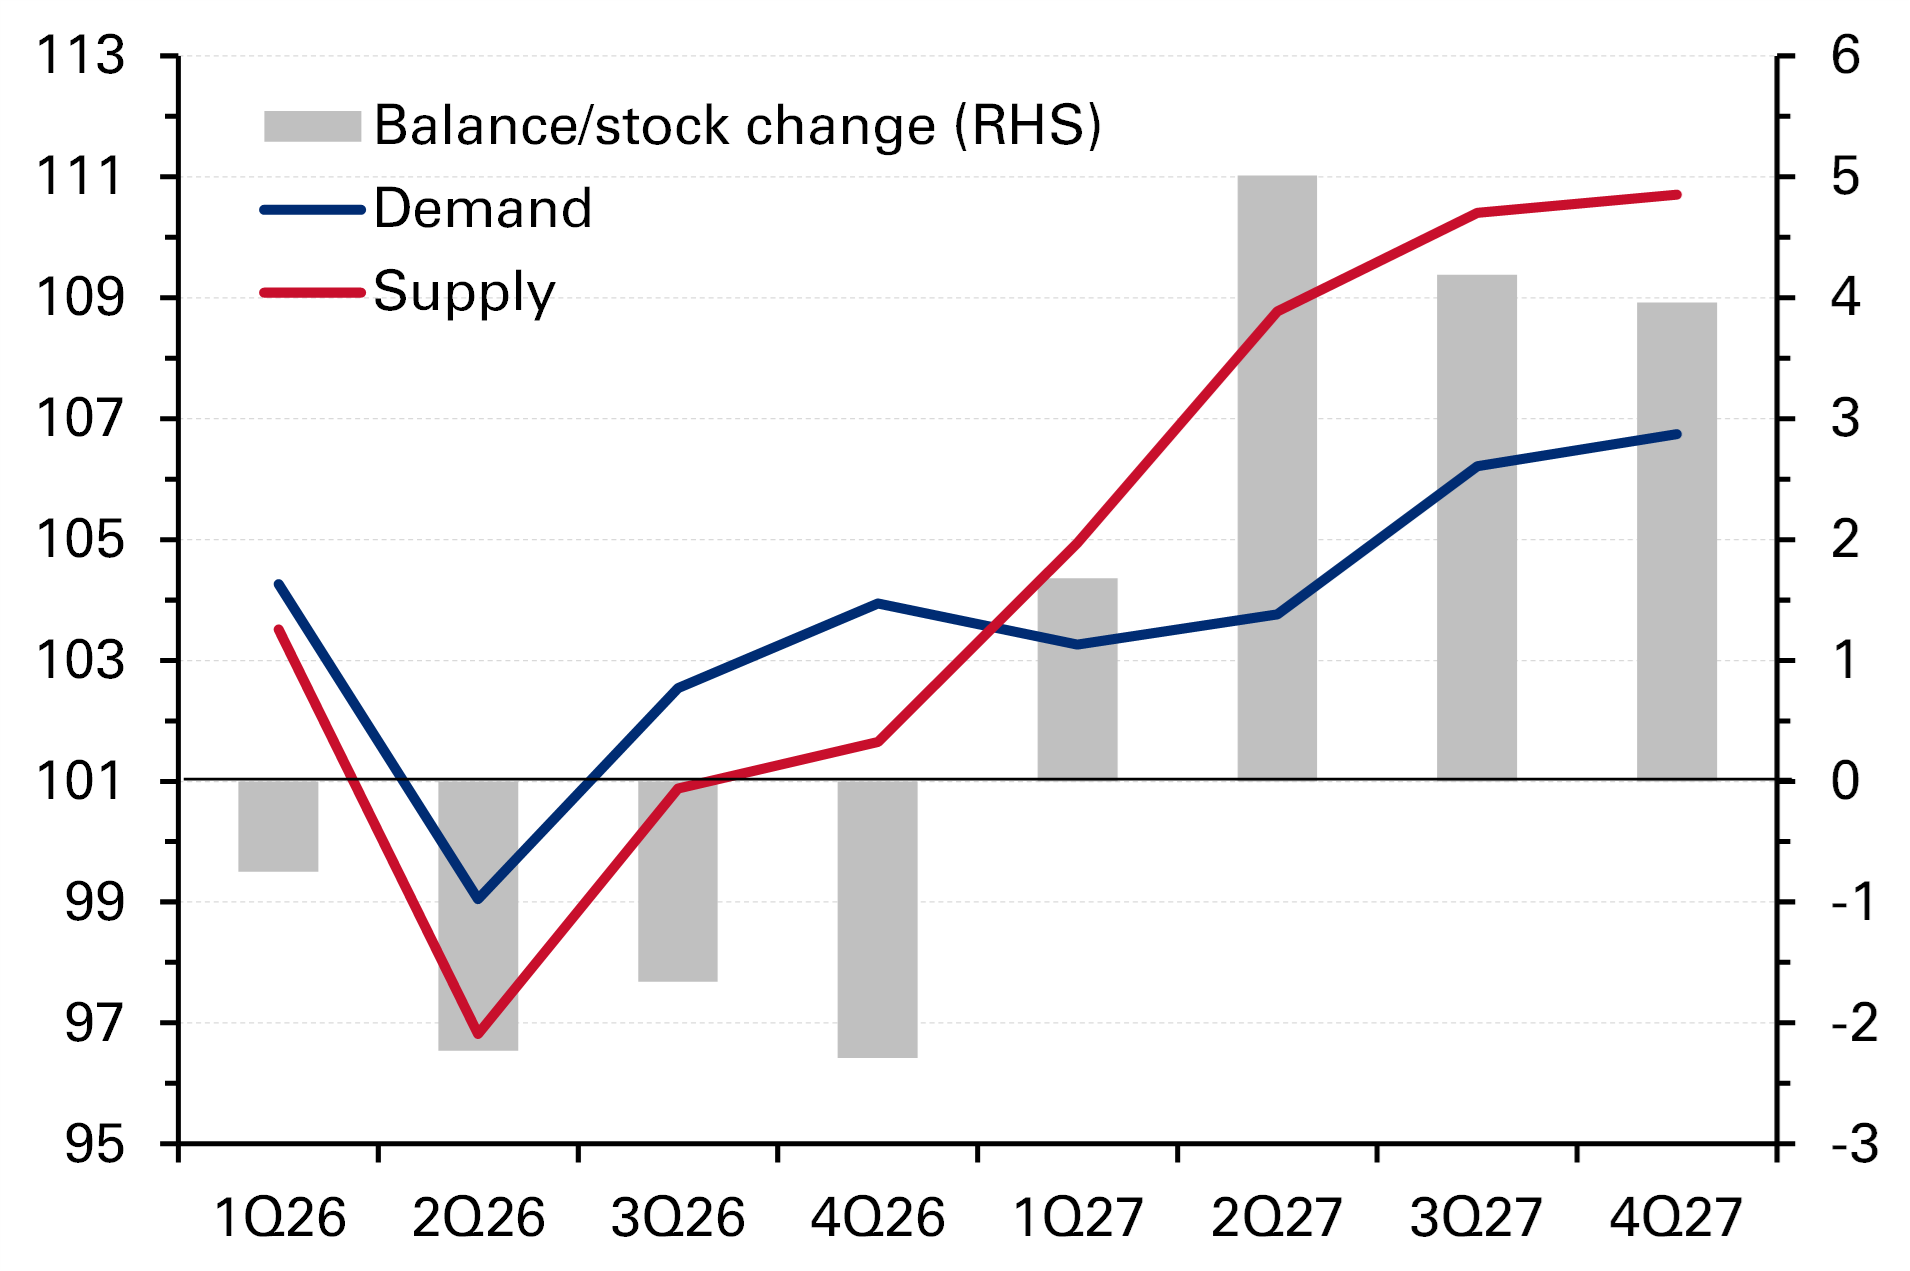
Continued disruptions to crude supplies, limited fuel product availability, and the impact of elevated oil prices have weighed heavily on global oil consumption in 2026. Reflecting this, the IEA has progressively lowered its oil demand assessment during the conflict. In September, it downgraded oil demand by a steep 940 kb/d and now sees it contracting by an average of 2.5 mb/d (to 102.5 mb/d) in 2026. Losses were heaviest in the April-June period (-5.3 mb/d y/y) and in Asian middle distillate (e.g. diesel) and petrochemical demand especially. China, by cutting oil imports and paring back domestic refinery runs, played a major part in bringing global demand closer to supply during the crisis. (Chart 3.) The rate of demand contraction is easing, though, the IEA says, with -3.4 mb/d estimated in Q3 and -2.0 mb/d in Q4. (Chart 4.) This still leaves oil consumption facing its first annual decline in six years, but unlike 2020, when Covid-19 lockdowns hammered demand, the shock this time originates on the supply side. For 2027, the IEA sees demand rebounding by a robust 2.6 mb/d to 105.1 mb/d, offsetting this year’s loss, on supply normalization and easing price pressures. A return to pre-conflict levels (~105 mb/d) is not likely until late 2027. The IEA has described 2026-27 as “essentially a lost period” for global oil consumption.
Oil supply: Gulf flows recovering, but non-MENA flows have surged to compensate for conflict losses
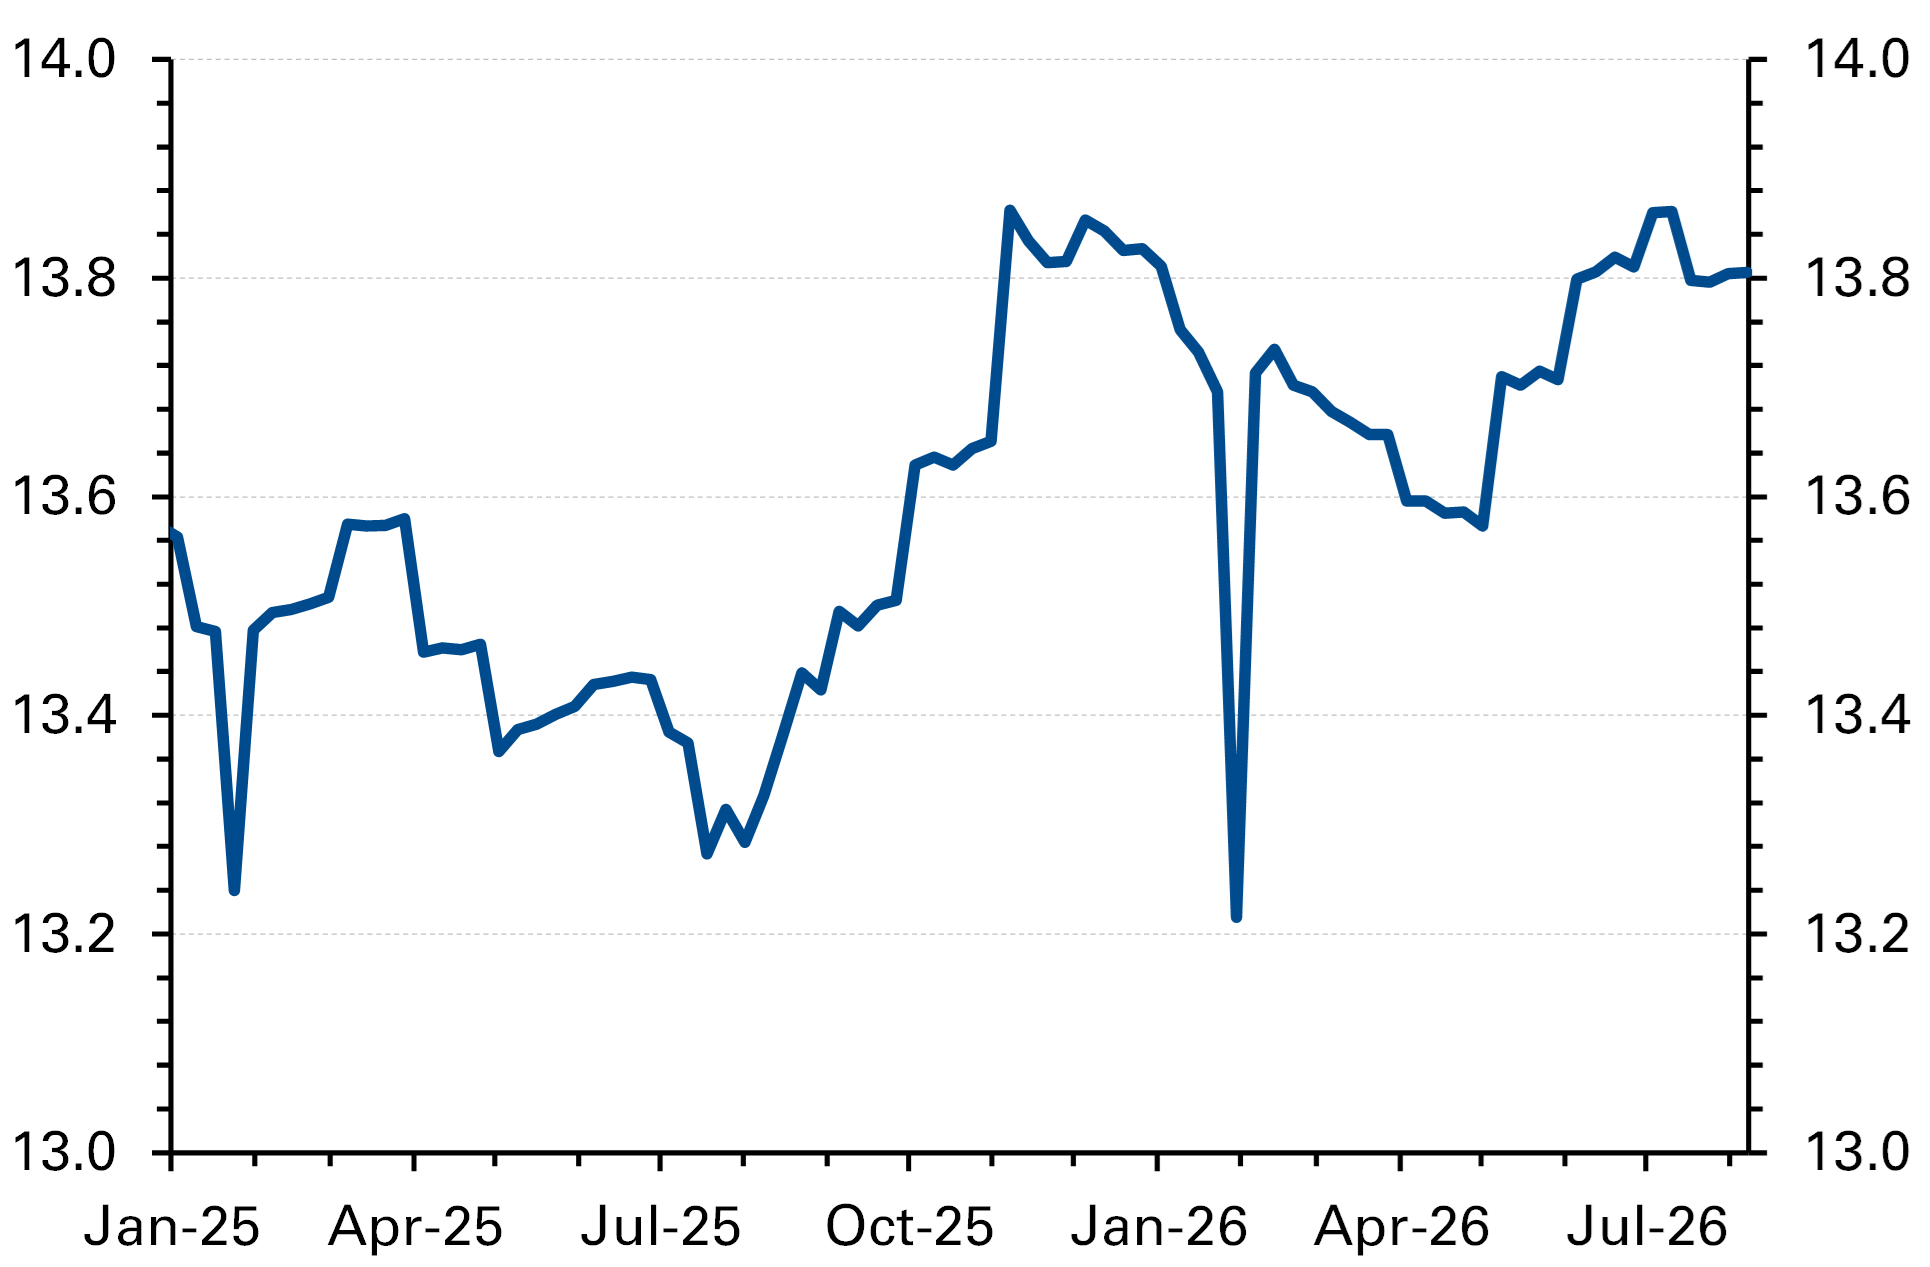
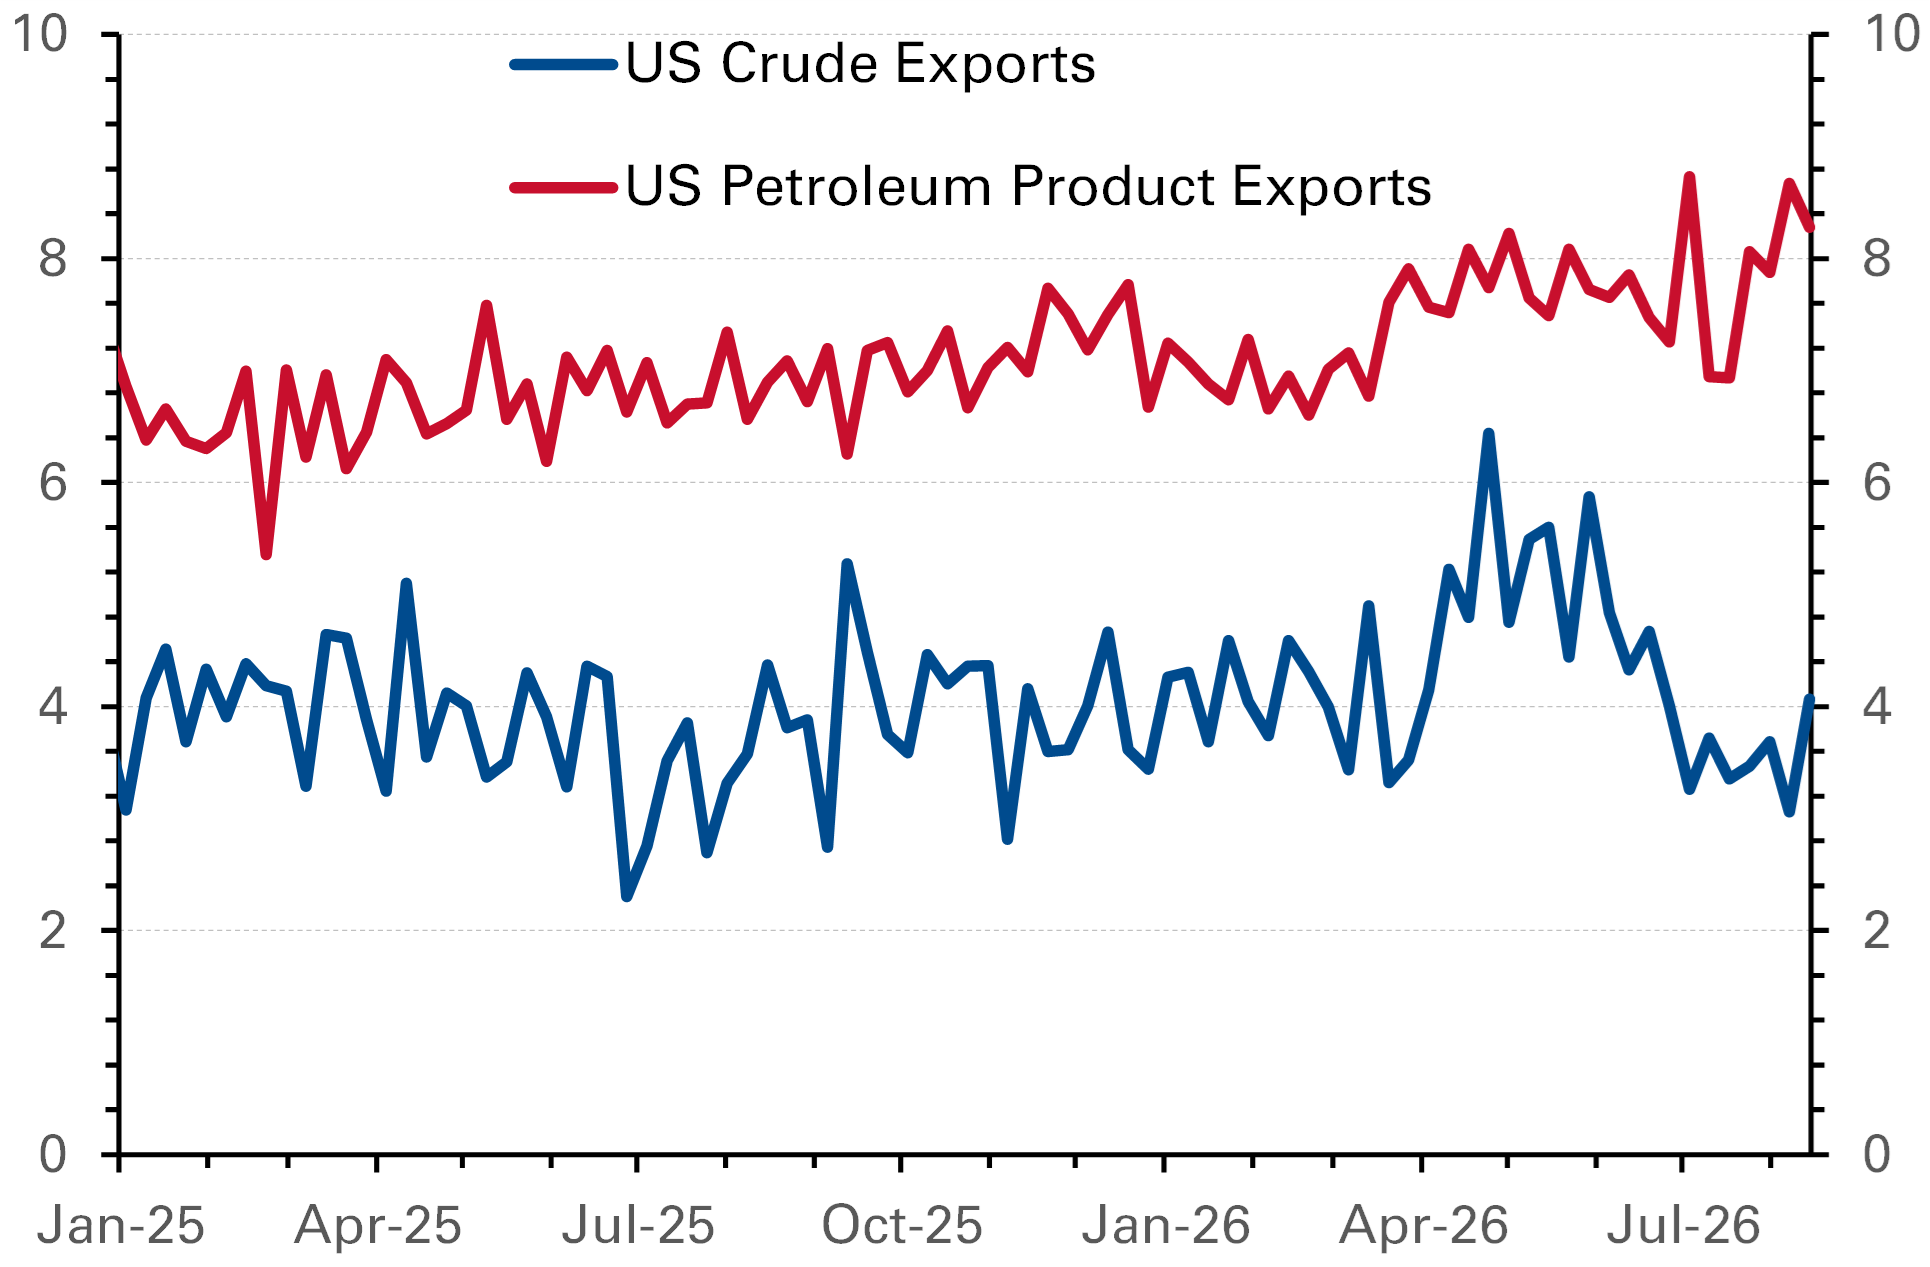
Estimates about the volume of oil exiting the Strait throughout the conflict have varied widely, with the US, which has provided security cover for vessels, often at the most bullish end of assessments compared to tanker tracking firms and even the IEA. US CENTCOM recently stated that 1 billion barrels of crude, equating to >16 mb/d, had been shipped in the August-September period, a massive volume that would bring oil flows to 80% of pre-conflict levels. The IEA has a far more conservative estimate of 7.6 mb/d for August, while anticipating a reduction in total global supply of 5.7 mb/d to 100.7 mb/d on average this year. Significantly, the agency estimates that oil exports from outside the Middle East have surged by a sizeable 2.3 mb/d on average since February, headed by the US (+520 kb/d), Brazil (+470 kb/d), Kazakhstan (+400 kb/d) and Venezuela (+300 kb/d). For 2027, supplies should rebound (+8 mb/d) led by the Gulf exporters.
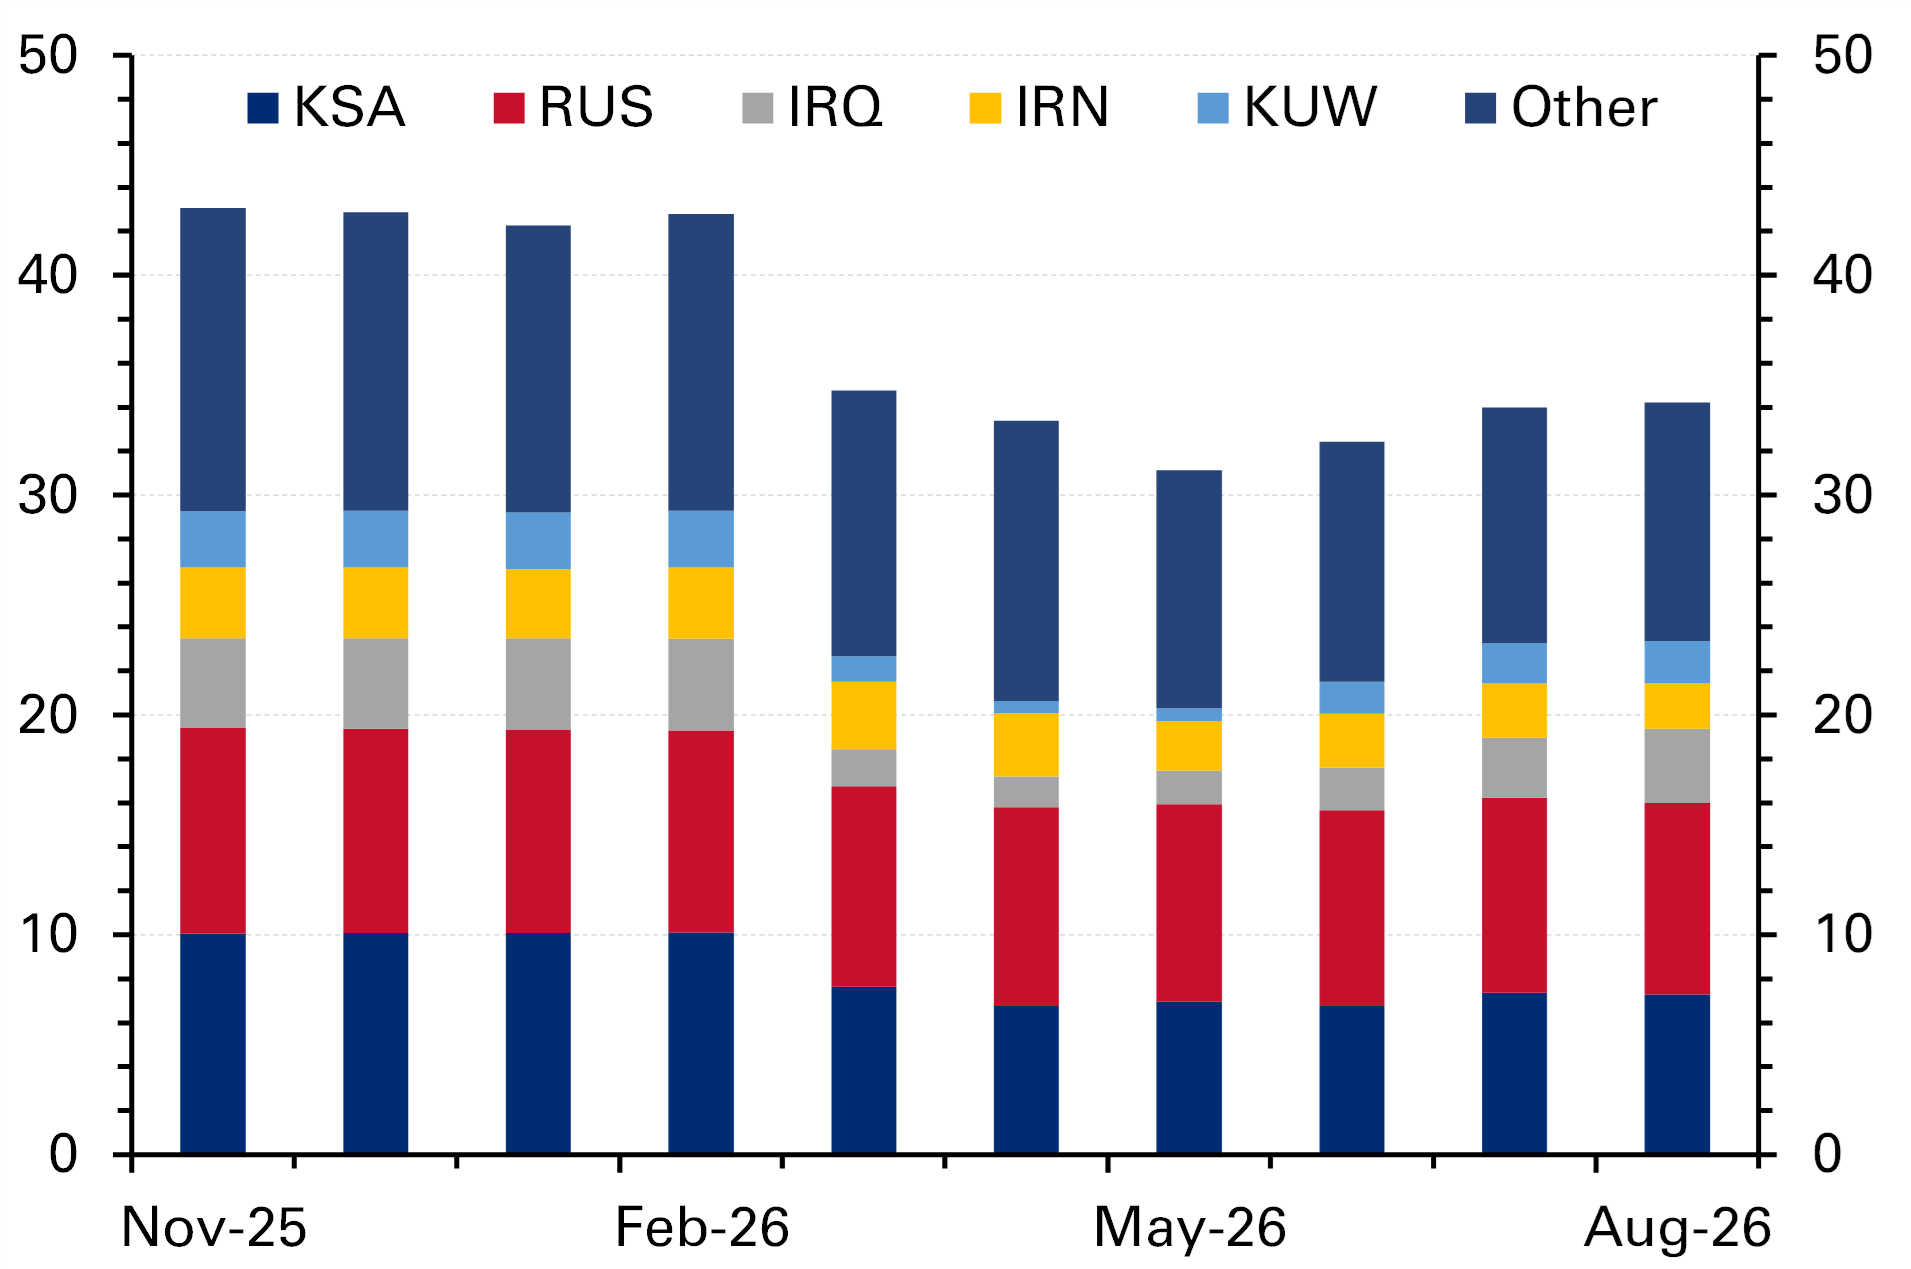
Despite persistent threats to regional oil infrastructure, workarounds by Gulf producers have proven durable and flows have risen since the breakdown of the US-Iran MoU in July. This is backed up by OPEC production data, which showed regional oil output rising in August for a fourth month in a row. Total DoC output increased to 34.3 mb/d. (Chart 5.) Among OPEC, Iraq and Kuwait have brought back the most production from their lows in April, reaching 3.4 mb/d and 1.9 mb/d, respectively, in August.
Oil inventories: record drawdowns have eased the supply shock, but left levels exposed to future crises
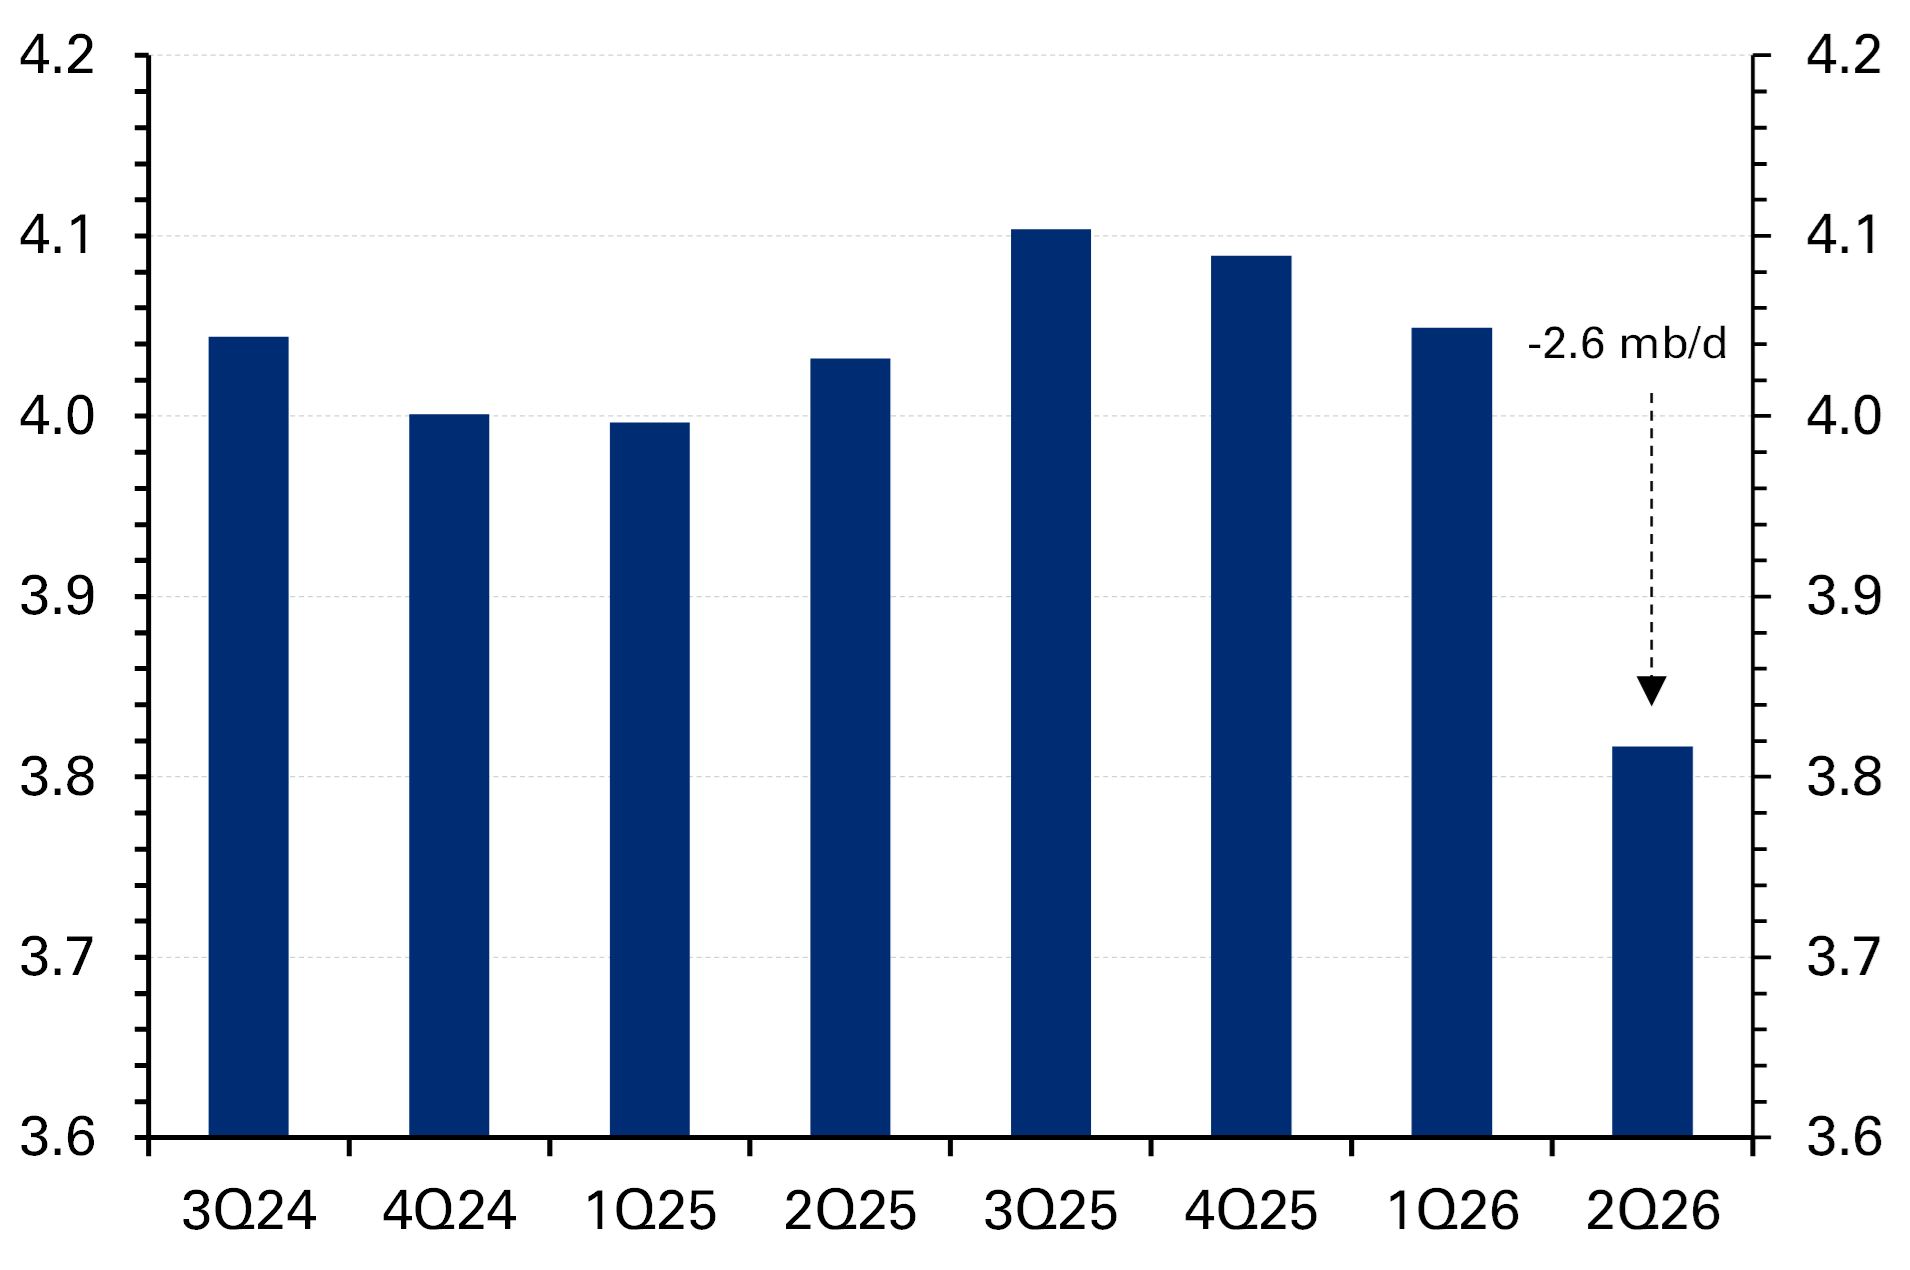
The rate of depletion of global oil inventories, at 2.8 mb/d over the last six months but a steeper 3.1 mb/d in August, has been unprecedented, the IEA has stated. Observed global oil stocks have declined by a cumulative 507 mb since the crisis (~8.3bn to ~7.8bn), with IEA member countries drawing down a combined 300 mb from their emergency reserves (out of 400 mb initially promised in March). In the US, SPR levels have fallen to their lowest since 1982 at 285 mb, close to minimum operational tank levels (250-300 mb), below which oil draws become physically more difficult. Stock draws have been the critical lever in meeting demand and preventing oil prices spiking even higher, helped also by the elevated inventory cover coming into the crisis. OECD oil stocks (on-land commercial and SPR) were down to 3.82 billion barrels by June’s close, a drawdown roughly equivalent to at least 2.6 mb/d from end-Q1, as per OPEC data. (Chart 6.) The focus on crude has masked the decline in middle distillate stocks, which have dropped below five-year average levels, and to the lowest in seven years for European jet fuel stocks.
Outlook: firmer price in the near term amid ongoing conflict risk and market supply deficits
Anticipating the direction for oil prices in the current circumstances is fraught with uncertainty. It depends almost entirely on a resolution to the conflict or, at the very least, SoH flows returning to pre-conflict levels. Near-term fundamentals are extremely tight and suggestive of firmer oil prices than the futures markets are pricing—as evidenced by physical crude prices; futures prices may also be underplaying the necessity if not the likelihood of an extended period of substantial global stock rebuilding once Gulf supplies normalize. The stressed refined product markets, with refining capacity stretched and depleted inventories, will likely lead the curve, with room for potentially more price growth in the short term before consumption is negatively affected. We have Brent ranging around $95/bbl in Q4 (averaging $90/bbl in 2026) falling to $80/bbl on average in 2027 linked to expectations of higher supplies and softer-than-expected demand/global economic growth.